Diagramming components for dependency visualization and analysis.
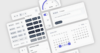
Auto Zoom - In order to navigate large hierarchies, the component folds as many nodes as needed in order to fit the chart into the available screen space. It shows a full size item and its immediate children and parents, so the user can click and navigate around the current item.
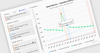
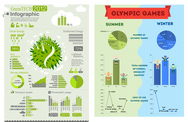
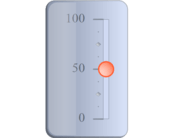
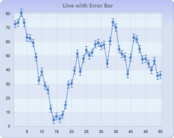
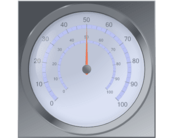
Chart Types - Includes the following types and variations: line, bar, area, pie, donut, point XY, bubble, candle (financial OHLC), Gantt, circular gauge, spark, activity gauge, maps, polar, radar, surface 3D and more.