すべてのコンポーネントカテゴリを見る
すべてのコンポーネントのタイプを見る
すべてのコンポーネント環境を見る
すべてのコンポーネント開発元/販売元を見る
すべてのアプリケーションカテゴリを見る
すべてのアプリケーション タイプを見る
すべてのアプリケーション開発元/販売元を見る
すべての追加のカテゴリを参照してください。
すべてのアドインのタイプを見る
すべてのアドイン開発元/販売元を見る
全てのブランドを見る
すべてのカテゴリーのニュースを見る
すべてのアーキテクチャのニュースを見る
すべてのニュースを見る
DevExpress
MESCIUS (旧社名:GrapeCity)
Telerik
Infragistics
combit
Text Control
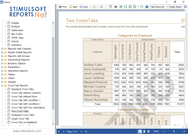
Stimulsoft
HOS
機能のハイライト
あらゆる分野のレポートに対応 - ActiveReportsは、会計、分析、予算、リスク分析、科学、カレンダー、スコアカード、保険、医療、臨床、株価分析などのビジネスレポートのデザインの開発支援ツールです.
クロスプラットフォームツール - 対話型でカスタマイズ可能なレポートを、クロスプラットフォームのスタンドアロンデザイナーアプリケーションを使用して構築 Windows、Mac、またはデスクトップLinuxにインストール可能で、豊富なデータ視覚化コンポーネントのセットを含む。.
Web用エンドユーザー向けレポートデザイナー - Webアプリのエンドユーザー向けにアドホックレポートデザインを提供 この埋め込み可能なコンポーネントにより、エンドユーザーは、簡単なドラッグアンドドロップインターフェイスと使い慣れた使いやすいUIを使用して、コードフリーでレポートを作成可能。.
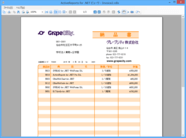
.NET用の卓越したレポートソリューション - 従来の帳票作成ソリューションの制限を克服するさまざまなツール、帳票作成ウィザード、組み込みテンプレート、エンドユーザー向けレポートデザイナーがあります。.
レポートと分析 - あらゆるプラットフォームとデバイスに対応した高パフォーマンスの意思決定支援システムと解析用ダッシュボードを作成。多種多様なUIコントロール、レポートツール、ダッシュボードを組み込めます。.
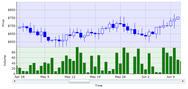
インタラクティブプレビュー - プレビューには、ドリルダウン、拡張可能な領域、アニメーション、並べ替え、レポートパラメータによる動的データフィルタリングを使用したインタラクティブなレポート機能が豊富に搭載。.
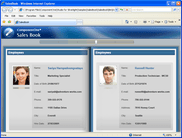
レポート デザイナー - アプリケーションでレポートを操作するための強力なレポートデザイナーと、レポートの作成と変更に使用できるスタンドアロンアプリケーションを含む このアプリケーションは、Microsoft WindowsとmacOSで利用可能です。.
Visual Report Designer - ズーム、元に戻す/やり直し、ガイドライン、ルーラーなどをサポート デザイナーでは、既存のレポートを変更するか新しいレポートを作成できるようになり、ランタイムはロイヤリティフリー.
強力なレポート管理 - Telerik Report Serverはスタンドアロンのレポート管理ソリューションとして使用することも、アプリケーションに組み込むこともできます。 テレリックレポーティングを搭載.
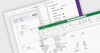
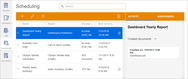
営業ダッシュボードレポート - 営業ダッシュボードのサンプルレポートで、営業部門のパフォーマンスの概要が簡単に利用可能.