公式サプライヤー
公式および認定ディストリビューターとして200社以上の開発元から正規ライセンスを直接ご提供いたします。
当社のすべてのブランドをご覧ください。

スクリーンショット: Graph chart showing social network of a person. ... 続きを読む この製品についてさらに結果を表示します。
スクリーンショット: Radial graph chart with expandable nodes showing social network. ... 続きを読む
スクリーンショット: Radial graph chart displaying all data showing category based data. ... 続きを読む

リリースノート: New component lets you add React Native charts and graphs to Android and iOS applications. React ... reactive. All charts and graphs are tested and built for millions of data points without any performance ... Native Component For FusionCharts With the new component, developers can add React Native charts ... 続きを読む この製品についてさらに結果を表示します。
説明: Spark Win/Loss Bullet Graphs Horizontal bullet graph Vertical bullet graph Other Charts Funnel Chart ... JavaScript (HTML5) charts and gauges that work across multiple devices and platforms. FusionCharts ... and responsive charts. From simple charts like line, column, and pie to domain-specific charts like heatmaps, ... 続きを読む
リリースノート: for Stacked Column chart. The background color of the Thermometer graph is now properly updated ... Updates in v3.13.1 Fixes... Chart was throwing runtime error while changing ... the 'chartType'. When map alias was prefixed with a path (e.g. ‘maps/’) drill down chart failed to render the maps. ... 続きを読む

リリースノート: (Winform/Wpf) when run as 64 bit. Fixes Direct3D 2D charts Graph and Scientific Graph real-time updating ... with AppendYData. Adds support for Direct3D 2D charting Graph and Scientific Graph zooming while real-time updating. ... MinimumSize feature to override the 75 pixel minimum control size to help with placing dozens of charts ... 続きを読む この製品についてさらに結果を表示します。
リリースノート: Fixed an issue where the new virtual data mechanism (9.5) would not chart the first data point ... zoombox to their respective far edges. Now the chart will undo the zoom state in this case. Fixed an issue ... 続きを読む
説明: , Scientific Graph, 3D Scientific Graph, Polar, and Pie Chart objects. GigaSoft ProEssentials comes ... Add financial, scientific, engineering and business charts to your applications. GigaSoft ... ProEssentials is a set of charting components for both Windows client-side and server-side development. GigaSoft ... 続きを読む

スクリーンショット: to automatically display graphs or flow charts following aesthetic rules. ... 続きを読む この製品についてさらに結果を表示します。
説明: to automatically display graphs or flow charts following some aesthetic rules. Includes: HFlow (hierarchical), ... A set of graph drawing algorithms. LayoutFlow is a collection of 4 layout components to enable you ... of these controls allows performing a graph layout automatically, positioning its vertices (also called nodes) ... 続きを読む
スクリーンショット: that performs a symmetric layout on a grap, TFlow that allows performing a tree layout on a graph and OFlow ... to perform an orthogonal layout on a graph. ... 続きを読む

説明: is an enterprise charting tool that allows you to develop charts or graphs and serve them as JPEG or PNG files ... and one for 3D. The ASP web server performs the chart creation and sends the completed charts and graphs ... Create browser-independent, dynamic charts for Active Server Pages (ASP). ComponentOne WebChart ... 続きを読む この製品についてさらに結果を表示します。
機能: so you can: Serve any Olectra Chart or graph as JPEG or PNG to any browser Serve charts as an ActiveX ... writing a single line of code Intelligent update for fast, real-time charting and tracking Built-in ... your high-performance 2D and 3D charts, ComponentOne WebChart's web server technology takes over ... 続きを読む
説明: change chart types and data values. True WebChart features two server-side charting components- one for 2 ... Applications ComponentOne WebChart gives you the same charting power as Olectra Chart but in an ASP environment ... Olectra Chart ActiveX controls. The Active Server Page (ASP) communicates with the server-side charting ... 続きを読む

リリースノート: Chart. Pareto Chart. Sankey Chart. 3D Scatter Chart. Stream Graph. Sunburst. Variable Pie. Variwide. ... Expanded collection of charts, client-side analytics, annotations, and a massive performance ... boost. Added Annotations module for annotating a chart with labels or shapes. Added the Boost module ... 続きを読む この製品についてさらに結果を表示します。
説明: chart Line chart Lollipop chart Network graph Organization chart Packed bubble Parallel coordinates ... Scatter chart Spline chart Stream graph Sunburst Timeline chart Treegraph chart Treemap Variable radius ... Data visualization, charts, and diagrams for web pages and web applications. Highcharts ... 続きを読む
スクリーンショット: Bullet graph (Sand Signika theme) 続きを読む

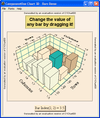
説明: high-performance 2D and 3D charts and graphs. Now with 2D and 3D Unicode controls for National Language Support. ... Create and customize virtually any type of chart. ComponentOne Chart provides hundreds ... of properties and methods to create an unlimited variety of charts with variations of color, style annotations, ... 続きを読む この製品についてさらに結果を表示します。
カスタマーレビュー: a few days looking at the examples you will see what a truly flexible charting control this is. I have ... have also not yet found a way of drawing a trendline (a manual one) on the graphs. All in all a good ... 続きを読む
説明: ほぼすべての種類のチャートを作成、およびカスタマイズできます。 ComponentOne Chart には、大変に多くのプロパティとメソッドが用意されているため、色、スタイル注釈、および遠近感 ... Chart 7.0 (以前の Olectra Chart) は、高パフォーマンスの 2D と 3D のチャートとグラフを簡単に作成するチャート作成ツールです。 現在は、National Language ... Support 用に、2D と 3D の Unicode コントロールが含まれています。 パフォーマンスを高めるために最適化された ComponentOne Chart は、科学チャートや会計チャート ... 続きを読む

説明: with 64-bit support. Chart Controls Create sophisticated charts and graphs with fast, real-time tracking ... charting tool that allows you to develop charts or graphs and serve them as JPEG or PNG files to any ... The ASP web server performs the chart creation and sends the completed charts and graphs to the browser. ... 続きを読む この製品についてさらに結果を表示します。
説明: へのエクスポートなどが含まれます。 ComponentOne WebChart (Chart を含む) ブラウザに依存しない、ダイナミックなチャートを Active Server Page (ASP) 用に作成 ... 続きを読む
スクリーンショット: Create browser-independent, dynamic charts for Active Server Pages (ASP) and VB Applications using ... ComponentOne WebChart or ComponentOne Chart ... 続きを読む

説明: a complete collection of charts and graphs for professional data visualization. It also comes with advanced ... to generate a wide array of charts for your browser based applications. jChartFX Plus Features Adaptive- ... you customize virtually any chart element. Browsers- jChartFX Plus is a browser-based charting engine ... 続きを読む この製品についてさらに結果を表示します。
説明: customize virtually any chart element. Browsers- jChartFX Plus is a browser-based charting engine that takes ... Chart Types Bar Charts Stacked Bar Charts 3D Bar Charts Area Charts Line and Stripe Charts Pie and ... 続きを読む
価格: jChartFX Plus- Development License + Support Development License Only, No Deployment, 1 Year Technical Support subscription included. Development License + Support Mfr. Part No: JCFX70DS Our Part No: 545731-1342771 jChartFX Plus- Single-Domain License Deployment for a Single Domain (Subdomains ... 続きを読む

仕様: Mobile ListView True DBGrid データ視覚化 【Enterprise限定機能】Financial Chart Bullet Graph Chart Chart ... 3D FlexChart FlexPie GanttView Gauges HTML Charts Linear Gauge Maps OrgChart RadialGauge Sparkline TreeMap ... 続きを読む この製品についてさらに結果を表示します。
仕様: ListBox Mobile ListView True DBGrid データ視覚化 【Enterprise限定機能】Financial Chart Bullet Graph Chart Chart3 ... 続きを読む
Licensing Fact Sheet: ... 続きを読む