
Total Access Statistics
Accessでデータの計算と解析を簡単に行えるアドイン
FMS 社の製品
2003 年より日本国内にてComponentSourceで販売中。
価格:¥ 124,300 (税込)〜 バージョン: 2016 (16.01.0031) 更新日: Jan 2, 2018
Accessでデータの計算と解析を簡単に行えるアドイン
FMS 社の製品
2003 年より日本国内にてComponentSourceで販売中。
価格:¥ 124,300 (税込)〜 バージョン: 2016 (16.01.0031) 更新日: Jan 2, 2018

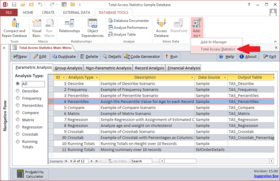
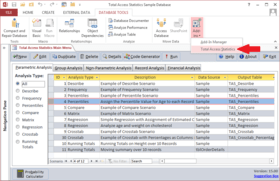
Accessのために特別に設計されたTotal Access Statistics が、Accessアドイン(ツール メニューから)として動作し、統計上のファンクションについてデータを分析するための広いレンジを提供します。データは、Accessのテーブルに配置することも、SQL サーバなどの他のソースからリンクできます。一度に複数フィールドとレコードの無制限の数を分析します。複数テーブルセレクトクエリからデータを分析することができます。

電話: (888) 850 9911
Fax: +1 770 250 6199


