公式サプライヤー
公式および認定ディストリビューターとして200社以上の開発元から正規ライセンスを直接ご提供いたします。
当社のすべてのブランドをご覧ください。
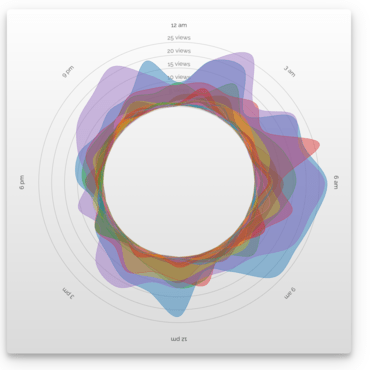
Vizuly Corona is a radial chart that provides angular and curved radial area line curves and supports both an overlap and stacked layout. It also features over a dozen different dynamic styles and comes bundled with an easy to use test container that demonstrates seven uniquely styled themes. Use the interactive style explorer on the left to view different style settings, themes, and other customizable properties.
Features
Framework Adapters

放射状の折れ線グラフと面グラフ
今すぐ Vizuly ライセンススペシャリストとライブ チャット。