公式サプライヤー
公式および認定ディストリビューターとして200社以上の開発元から正規ライセンスを直接ご提供いたします。
当社のすべてのブランドをご覧ください。
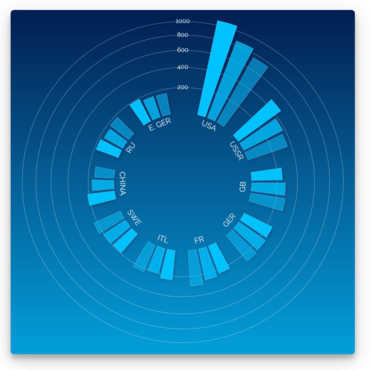
Vizuly Radial Bar is designed to represent cartesian x/y data within a radial plot. It supports both clustered and stacked radial bars Use the interactive style explorer on the left to view different style settings, themes, and other customizable properties.
Features
Framework Adapters

直交座標のxとyのデータを放射状にプロット
今すぐ Vizuly ライセンススペシャリストとライブ チャット。