機能
- The new Drill Down Graph PRO
- New pre-set layouts for visualizing dependency relations - The latest version of Drill Down Graph Pro comes with two new layout options - radial and hierarchical (also known as organization tree). Both enables users to clearly visualize and detect chain of dependencies.
- Enhanced navigation with custom expansion levels, direction and radius - This new bundle of features enables report creators to fully control the graph exploration experience:
- Set focus nodes.
- Set initial level of expansion (how many levels to show right away).
- Set how many levels to open on click (expansion radius).
- Set direction for expansion (source to target, target to source or both directions).
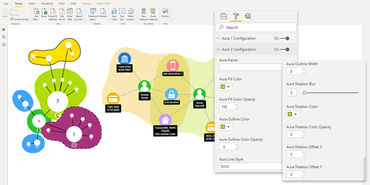
- Auras for better relationship detection - Auras are also a completely new feature that allows to visualize relations among the nodes by grouping them in color categories. Auras can be set for source and target nodes, split into categories and customized to match the overall theme of the report.
- Additional new customization options - Graphs now have additional data fields and customization options that will offer greater control over the look of the chart and provide opportunities to add additional information.
- Upgraded toolbar for better user experience - The new toolbar offers more options to control the graph exploration experience. It’s also possible to customize the toolbar by switching on/off any of the 13 items:
- Enable/disable option to change expand direction.
- Use save state to pass on to the users the exact layout you have set up (almost as bookmark).
- Use display mode to always show the graph in an expanded state.
- Enable reset button to help user to return to the initial state of the visual.
- Enable/Disable Search option to find the exact nodes you were looking for.
- Measure support - Visuals that now have full measure support are Donut, Pie, Combo, Combo Bar. Full drillthrough and Report Page Tooltip support (from any drilldown level) is also enabled for these visuals.
- Features to improve user experience
- All visuals now have a reset button, allowing the report end-user to quickly return to the initial state and cancel all previously applied filters or drilldowns.
- The Drill Down Combo PRO visual now allows you to choose how to handle visualization of empty data points. Depending on your needs, you have 3 options:
- Skip empty data points. Chart line will have interruptions where empty data points should be.
- Join. In this case chart line won’t be interrupted, it will connect all data points with values.
- Zero. Empty data points will be displayed as zero values in the chart.
- Automatic gradient for Donut and Pie PRO
- Use this feature to create stunning donut, pie and gauge charts with just one color.
スムーズなドリルダウンとドリルアップ機能でPower BIを快適に操作

2018に公式ディストリビューターとして登録
