公式サプライヤー
公式および認定ディストリビューターとして200社以上の開発元から正規ライセンスを直接ご提供いたします。
当社のすべてのブランドをご覧ください。
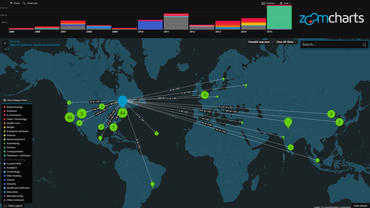
ZoomCharts JavaScript Charts Library is a JavaScript/HTML library that helps you add visually rich and interactive charts to your application. With only a minimal amount of code, you can visualize your data and let your users discover new insights.
On November 3rd, 2021, at 1:00 PM EDT, ZoomCharts is presenting a webinar that will show you how to take your JavaScript charts to the next level by leveraging the powerful new features that are being implemented in the upcoming year, such as how to utilize the qualities of WebGL to render faster and better for more data insights.
This includes:
Register now to attend this informative webinar.

Webアプリケーション用JavaScriptグラフライブラリで、ドリルダウンとマルチタッチ操作対応のグラフを組み込み
今すぐ ZoomCharts ライセンススペシャリストとライブ チャット。