
Vizuly Line Area Chart(英語版)
JavaScriptアプリに折れ線グラフと面グラフを追加
Vizuly Professional includes all Vizuly components at a significant discount.
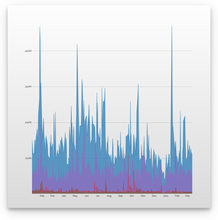
Vizuly Line Area Chart supports both line and area plots in several different layout options. It also comes bundled with a test container demonstrating the various chart properties and different style themes. You can either drop this component directly into your application using its straightforward API, or use it as a starting point for modification and extension.


画像1 / 6
Features
Framework Adapters
Vizuly Line Area Chart(英語版)は、次の製品にも含まれています。
今すぐ Vizuly ライセンススペシャリストとライブ チャット。
電話: (888) 850 9911
Fax: +1 770 250 6199


 のスクリーンショット")