
Vizuly Scatter Plot(英語版)
JavaScriptアプリに散布図を追加
Vizuly Professional includes all Vizuly components at a significant discount.
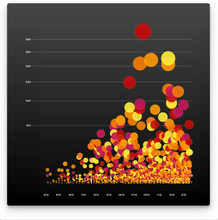
Vizuly Scatter Plot shows 3 dimensions of data at once by plotting values along both the x and y axis as well as the radius of the plot itself. Each plot can be colored and styled dynamically based on your data.


画像1 / 5
Features
Framework Adapters
Vizuly Scatter Plot(英語版)は、次の製品にも含まれています。
今すぐ Vizuly ライセンススペシャリストとライブ チャット。
電話: (888) 850 9911
Fax: +1 770 250 6199


 のスクリーンショット")