
Vizuly Venn Diagram(英語版)
JavaScriptアプリにベン図を追加
Vizuly Professional includes all Vizuly components at a significant discount.
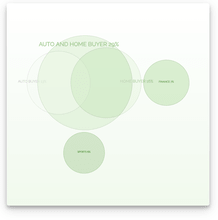
Vizuly Venn Diagram shows all possible logical relations between a finite collection of different sets. This chart depicts elements as points in the plane, and sets as regions inside closed curves. A Venn diagram consists of multiple overlapping closed curves, usually circles, each representing a set. Using data bound dynamic styles you can declare different colors and visual attributes unique to each set.


画像1 / 6
Features
Framework Adapters
Vizuly Venn Diagram(英語版)は、次の製品にも含まれています。
今すぐ Vizuly ライセンススペシャリストとライブ チャット。
電話: (888) 850 9911
Fax: +1 770 250 6199


 のスクリーンショット")