公式サプライヤー
公式および認定ディストリビューターとして200社以上の開発元から正規ライセンスを直接ご提供いたします。
当社のすべてのブランドをご覧ください。
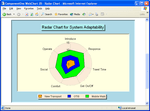
スクリーンショット: Create a Radar Chart amongst others. Rank based upon different criteria. Select/deselect the "Filled" and "Stacked" check boxes to change the appearance of the displayed data. ...
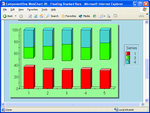
スクリーンショット: Show/Hide/Exclude list boxes and check boxes. ...
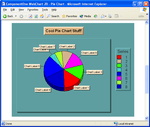
スクリーンショット: Use the Pie Sorting Methods list box to change how the pie slices are sorted, Use the Chart Labels check box to control the display of ChartLabels on the chart, Use the Threshold controls to specify how to create the "other" slice, and the other ...
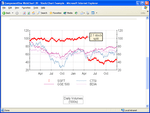
スクリーンショット: Create stock charts for your web applications. ...
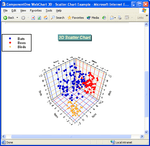
スクリーンショット: Ccreate and customize a 3D scatter chart amongst others ...
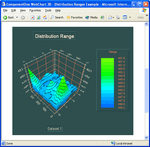
スクリーンショット: Using the 3D Design-Time Control to set the DistributionRange property to control the number of levels in the legend, to use the LabelFilter property of the Legend object to show a specific number of levels and to show the legend as either Stepped or ...
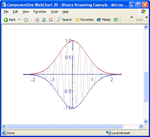
スクリーンショット: Perform 2D Binary Streaming. ...
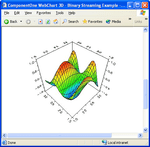
スクリーンショット: Perform 3D Binary Streaming. ...