公式サプライヤー
公式および認定ディストリビューターとして200社以上の開発元から正規ライセンスを直接ご提供いたします。
当社のすべてのブランドをご覧ください。
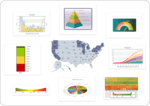
スクリーンショット: Why use a column chart when a funnel chart is what you need? Incorrect chart types lead to incorrect analysis, which in turn lead to incorrect business decisions. Your users deserve better. FusionCharts Suite XT brings you 90 chart types right from the ...

スクリーンショット: Why use a column chart when a funnel chart is what you need? Incorrect chart types lead to incorrect analysis, which in turn lead to incorrect business decisions. Your users deserve better. FusionCharts Suite XT brings you 90 chart types right from the ...
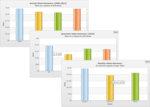
スクリーンショット: The Charts don't just look good; they feel good too! Fusioncharts are highly interactive with drill-down, tooltips, zooming, panning, chart export and visual editing. Makes for an enjoyable reporting experience. ...

スクリーンショット: The Charts don't just look good; they feel good too! Fusioncharts are highly interactive with drill-down, tooltips, zooming, panning, chart export and visual editing. Makes for an enjoyable reporting experience. ...
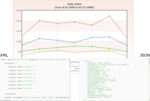
スクリーンショット: FusionCharts Suite XT supports both JSON and XML data formats. So when you are integrating the charts with other JavaScript frameworks, JSON is an ideal choice. And when you are working with server-side business applications, XML becomes more convenient ...

スクリーンショット: FusionCharts Suite XT supports both JSON and XML data formats. So when you are integrating the charts with other JavaScript frameworks, JSON is an ideal choice. And when you are working with server-side business applications, XML becomes more convenient ...

スクリーンショット: Creating an information portal or business monitoring dashboard? Surely your users would like to export the charts for their presentations or emails. Enable export to JPG, PNG and PDF programmatically, or through user interaction. ...
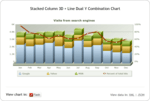
スクリーンショット: In addition to all the general purpose charts, FusionCharts XT offers advanced charts like Combination, Scroll, Zoom Line, XY Plot, Marimekko and Pareto charts. ...
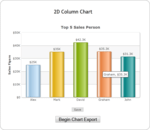
スクリーンショット: Exporting or saving the chart data is just a click away. ...

スクリーンショット: Get inspired, learn charting best practices and jumpstart your development with the numerous real-life business demos FusionCharts Suite XT offers. ...
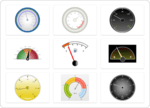
スクリーンショット: Angular Gauges are essentially like the speedometer or fuel gauge of your car. They use a radial scale to display your data range and a dial is used to indicate the data value. ...
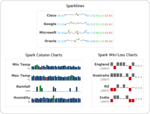
スクリーンショット: Sparks charts are "data-intense, design-simple, word-sized graphics" charts for embedding in a context of words, numbers, and images. Whereas the typical chart is designed to show as much data as possible, and is set off from the flow of text, ...
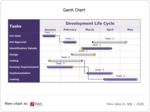
スクリーンショット: The Gantt chart is a specialized chart used for displaying various timelines like project timelines, development timelines etc. It can be used for any of the following; planning and scheduling projects, assessing how long a project should take, laying out ...
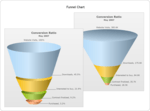
スクリーンショット: Funnel charts are basically used to plot streamlined data, e.g. plotting sales data for sales pipeline analysis. A funnel chart consists of various segments, each representing a data set. ...
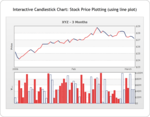
スクリーンショット: The candle stick chart offers you a powerful and interactive interface to plot your stock data. It offers the following features: Integrated price and volume plot. Volume plot can be turned on or off. Multiple options for price plotting- Candle stick / ...
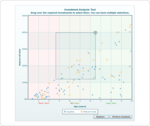
スクリーンショット: The Select Scatter chart is a special type of chart that allows users to visually select a subset of data from the given data points. Essentially, it's an extension of XY Plot Chart (Scatter Chart) from FusionCharts v3 with the added functionality of ...
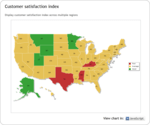
スクリーンショット: Display customer satisfaction index across multiple regions. ...
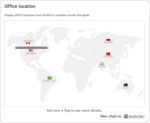
スクリーンショット: World Map showing office locations with markers. ...
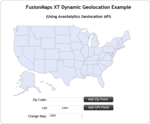
スクリーンショット: The interactive map above utilizes Avantalytics' RESTful API to allow you to dynamically place any number of points on any FusionMaps XT U.S. map (including state maps) using either a zip code or GPS coordinates without having to pre-define the point ...