公式サプライヤー
公式および認定ディストリビューターとして200社以上の開発元から正規ライセンスを直接ご提供いたします。
当社のすべてのブランドをご覧ください。

スクリーンショット: A box plot visualizes key statistical measures for a data set, such as the median, mean and quartile values. ...

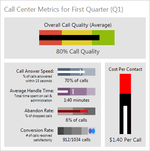
スクリーンショット: A bullet graph is a special kind of bar chart used to display a single value in a context of one or more related values. ...

スクリーンショット: A heat map is a type of chart that displays a data value matrix represented through markers of varying colors and/or sizes. The gradient used to determine the color to render for any given value is fully customizable. ...

スクリーンショット: A segment chart provides a visual representation of an integer value in relation to a total number. Each segment in the chart is rendered as highlighted or unhighlighted. For instance, if the value is 3 of 10, there will be 10 total segments displayed, ...