公式サプライヤー
公式および認定ディストリビューターとして200社以上の開発元から正規ライセンスを直接ご提供いたします。
当社のすべてのブランドをご覧ください。

スクリーンショット: Quickly bind and display your data with little coding or configuration. Features include filtering, sorting, templates, and movable columns. 0 ...

スクリーンショット: Simplifies the complexities of the data visualization domain into manageable API. 0 ...

スクリーンショット: The Financial Chart is a charting component that makes it easy to visualize financial data by using a simple and intuitive API. 0 ...

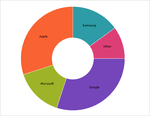
スクリーンショット: The doughnut chart can display multiple variables in concentric rings, and provides built-in support for visualizing hierarchical data. 0 ...

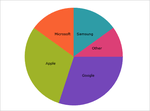
スクリーンショット: The Pie Chart is a specialized component that renders a pie chart, consisting of a circular area divided into sections. Each section has arc length proportional to its underlying data value. 0 ...

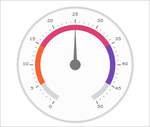
スクリーンショット: The Radial Gauge component provides a number of visual elements, like a needle, tick marks, ranges, and labels, in order to create a predefined shape and scale. 0 ...