公式サプライヤー
公式および認定ディストリビューターとして200社以上の開発元から正規ライセンスを直接ご提供いたします。
当社のすべてのブランドをご覧ください。

説明: WebAssembly Charts and Graphs- Build expressive dashboards for deep analytics, and render millions of data ... points in real time, with more than 65 high performance Blazor charts and graphs. Optimized for both ... to graph your data, including bar chart, line chart, column chart, pie chart, area chart, Treemap chart ... 続きを読む この製品についてさらに結果を表示します。
説明: types to graph your data, including bar chart, line chart, column chart, pie chart, area chart, Treemap ... features for Blazor charts. All the Features You Need- Just Like Excel Charts- Choose from over 65 chart ... chart, geospatial maps, stock charts, and much more. Even better, you get all of the best features your ... 続きを読む

説明: is an enterprise charting tool that allows you to develop charts or graphs and serve them as JPEG or PNG files ... and one for 3D. The ASP web server performs the chart creation and sends the completed charts and graphs ... Create browser-independent, dynamic charts for Active Server Pages (ASP). ComponentOne WebChart ... 続きを読む この製品についてさらに結果を表示します。
説明: change chart types and data values. True WebChart features two server-side charting components- one for 2 ... Applications ComponentOne WebChart gives you the same charting power as Olectra Chart but in an ASP environment ... Olectra Chart ActiveX controls. The Active Server Page (ASP) communicates with the server-side charting ... 続きを読む

説明: chart Line chart Lollipop chart Network graph Organization chart Packed bubble Parallel coordinates ... Scatter chart Spline chart Stream graph Sunburst Timeline chart Treegraph chart Treemap Variable radius ... Data visualization, charts, and diagrams for web pages and web applications. Highcharts ... 続きを読む この製品についてさらに結果を表示します。
説明: WebページとWebアプリケーション用のデータの可視化、グラフ、ダイアグラム HighchartsはJavaScriptを使ってグラフを作成する業界屈指のライブラリです。Highchartsは何万人もの開発者並びに世界の大企業100社の80%以上で使われています。Highchartsは2009年から積極的に開発を行っている、SVGをベースとしたマルチプラットフォームチャートライブラリです。インタラクティブでモバイル環境に最適化されたグラフを簡単にウェブページやモバイルアプリに追加できます。充実した文書をはじめ、高度な応答性、業界屈指のアクセシビリティを特徴としています。 ... 続きを読む

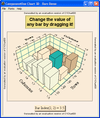
説明: high-performance 2D and 3D charts and graphs. Now with 2D and 3D Unicode controls for National Language Support. ... Create and customize virtually any type of chart. ComponentOne Chart provides hundreds ... of properties and methods to create an unlimited variety of charts with variations of color, style annotations, ... 続きを読む この製品についてさらに結果を表示します。
説明: ほぼすべての種類のチャートを作成、およびカスタマイズできます。 ComponentOne Chart には、大変に多くのプロパティとメソッドが用意されているため、色、スタイル注釈、および遠近感 ... Chart 7.0 (以前の Olectra Chart) は、高パフォーマンスの 2D と 3D のチャートとグラフを簡単に作成するチャート作成ツールです。 現在は、National Language ... Support 用に、2D と 3D の Unicode コントロールが含まれています。 パフォーマンスを高めるために最適化された ComponentOne Chart は、科学チャートや会計チャート ... 続きを読む

説明: - A wide range of charts, graph types and series that enable you to visualize data according to the native ... Charts, DatePicker, TabView, Editors and others. Desktop support is offered for all controls, a new ... with data binding, load on demand, filtering, grouping, sorting, customizable items, and more. Charts ... 続きを読む この製品についてさらに結果を表示します。
説明: more. Charts- A wide range of charts, graph types and series that enable you to visualize data ... ItemsControl DataGrid DataForm Data Visualization Rating Map Gauge Barcode Charts Spline Chart Spline Area ... Chart Scatter Spline Chart Scatter Spline Area Chart Scatter Point Chart Scatter Line Chart Scatter Area ... 続きを読む

説明: Graphs- A bullet graph is a special kind of bar chart used to display a single value in a context of one ... Small charts and sparklines designed to visualize complex data. Actipro Micro Charts for WPF ... is a set of charts that visualize quantitative data and are designed to render clearly in compact spaces. ... 続きを読む この製品についてさらに結果を表示します。
説明: . Bullet Graphs- A bullet graph is a special kind of bar chart used to display a single value in a context ... WPFはソースコードも利用可能です。ランタイムロイヤリティフリー。 Actipro Micro Charts Features Line Charts- A line chart renders ... numerous built-in shapes or can be set to use custom shapes. Area Charts- An area chart is a derivative of ... 続きを読む

説明: High-performance Charts and Graphs for WPF, WinForms and UWP. LightningChart.NET is a high ... performing charting library for desktop application development, fully GPU-accelerated with a rendering ... to be the fastest charting library in the world for desktop and web." says Pasi Tuomainen, LightningChart CEO. ... 続きを読む この製品についてさらに結果を表示します。
説明: 高性能WPF、WinForms、UWPのチャートとグラフ LightningChart.NET is a high performing charting library for desktop ... D and 3D graphics. "LightningChart has proven to be the fastest charting library in the world ... control with a full optimization towards performance of charting components. Data visualization SDK ... 続きを読む

説明: component to visualize your application data. It contains a rich gallery of charts and graphs and its high ... Modern charts made easy for C# and VB.NET applications. BuniCharts is a well-crafted chart ... designers and developers to draw all kinds of charts on their WinForms application. It offers a great array ... 続きを読む この製品についてさらに結果を表示します。
説明: 最新のグラフを、C#およびVB.NETアプリケーションで簡単に作成 BuniCharts is a well-crafted chart component to visualize your ... with interactivity powered by chart animations. BuniCharts provides an easy way to plot beautiful data ... visualizations in your.NET project. Packaged as a DLL it includes drag and drop chart components that plot on a ... 続きを読む

説明: Components: Chart- Telerik UI for Xamarin Charts includes a vast number of chart and graph kinds, as well ... as series, that allow you to view data using native Desktop, iOS, and Android standards. Different chart ... and graph formats, such as Line, Area, and Spline Area, can be used to compare sets of data using horizontal ... 続きを読む この製品についてさらに結果を表示します。
説明: Components: Chart- Telerik UI for Xamarin Charts includes a vast number of chart and graph kinds, as well as ... series, that allow you to view data using native Desktop, iOS, and Android standards. Different chart and ... graph formats, such as Line, Area, and Spline Area, can be used to compare sets of data using horizontal ... 続きを読む

説明: and relationship charts and graphs. Its basic types of objects- boxes, tables, and arrows- can be grouped ... Workflow processes Object hierarchies and relationships Graphs and networks Entity-relationship (ER) / ... Organizational charts XML documents Classification hierarchies The software has been tested with Visual Studio ... 続きを読む この製品についてさらに結果を表示します。
説明: .NET Compact Frameworkでフローチャート作成アプリケーションを開発 PocketChart は、ワークフローおよび、フローチャート、ネットワーク、プロセス、データベースERダイアグラム、構造化、階層と関係のチャートとグラフに関する、作成と運用を支援します。 オブジェクトの基本的なタイプである、ボックス/テーブル/アローは、グループ化と相互のアタッチが可能であり、また、複雑な構造への結合にも対応します。 そのコントロールは、カスタムなシェイプの作成のために、70 種類以上の定義済みのボックス/テーブル/アローを含みます。PocketChart は、Visual Studio ... 続きを読む