公式サプライヤー
公式および認定ディストリビューターとして200社以上の開発元から正規ライセンスを直接ご提供いたします。
当社のすべてのブランドをご覧ください。

リリースノート: Chart. Pareto Chart. Sankey Chart. 3D Scatter Chart. Stream Graph. Sunburst. Variable Pie. Variwide. ... Expanded collection of charts, client-side analytics, annotations, and a massive performance ... boost. Added Annotations module for annotating a chart with labels or shapes. Added the Boost module ... 続きを読む この製品についてさらに結果を表示します。
説明: chart Line chart Lollipop chart Network graph Organization chart Packed bubble Parallel coordinates ... Scatter chart Spline chart Stream graph Sunburst Timeline chart Treegraph chart Treemap Variable radius ... Data visualization, charts, and diagrams for web pages and web applications. Highcharts ... 続きを読む
スクリーンショット: Bullet graph (Sand Signika theme) 続きを読む

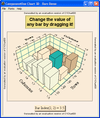
説明: high-performance 2D and 3D charts and graphs. Now with 2D and 3D Unicode controls for National Language Support. ... Create and customize virtually any type of chart. ComponentOne Chart provides hundreds ... of properties and methods to create an unlimited variety of charts with variations of color, style annotations, ... 続きを読む この製品についてさらに結果を表示します。
カスタマーレビュー: a few days looking at the examples you will see what a truly flexible charting control this is. I have ... have also not yet found a way of drawing a trendline (a manual one) on the graphs. All in all a good ... 続きを読む
説明: ほぼすべての種類のチャートを作成、およびカスタマイズできます。 ComponentOne Chart には、大変に多くのプロパティとメソッドが用意されているため、色、スタイル注釈、および遠近感 ... Chart 7.0 (以前の Olectra Chart) は、高パフォーマンスの 2D と 3D のチャートとグラフを簡単に作成するチャート作成ツールです。 現在は、National Language ... Support 用に、2D と 3D の Unicode コントロールが含まれています。 パフォーマンスを高めるために最適化された ComponentOne Chart は、科学チャートや会計チャート ... 続きを読む

説明: - A wide range of charts, graph types and series that enable you to visualize data according to the native ... Charts, DatePicker, TabView, Editors and others. Desktop support is offered for all controls, a new ... with data binding, load on demand, filtering, grouping, sorting, customizable items, and more. Charts ... 続きを読む この製品についてさらに結果を表示します。
説明: more. Charts- A wide range of charts, graph types and series that enable you to visualize data ... ItemsControl DataGrid DataForm Data Visualization Rating Map Gauge Barcode Charts Spline Chart Spline Area ... Chart Scatter Spline Chart Scatter Spline Area Chart Scatter Point Chart Scatter Line Chart Scatter Area ... 続きを読む
スクリーンショット: 0 ... 続きを読む

説明: Graphs- A bullet graph is a special kind of bar chart used to display a single value in a context of one ... Small charts and sparklines designed to visualize complex data. Actipro Micro Charts for WPF ... is a set of charts that visualize quantitative data and are designed to render clearly in compact spaces. ... 続きを読む この製品についてさらに結果を表示します。
説明: . Bullet Graphs- A bullet graph is a special kind of bar chart used to display a single value in a context ... WPFはソースコードも利用可能です。ランタイムロイヤリティフリー。 Actipro Micro Charts Features Line Charts- A line chart renders ... numerous built-in shapes or can be set to use custom shapes. Area Charts- An area chart is a derivative of ... 続きを読む
リリースノート: Updated and added UIA peers for numerous controls to better support accessibility updates in.NET 8. API documentation is now based on assemblies that target Microsoft.NET 6 (previously.NET Framework). The Sample Browser application included with the installer will now multi-target.NET Framework 4.6 ... 続きを読む

説明: High-performance Charts and Graphs for WPF, WinForms and UWP. LightningChart.NET is a high ... performing charting library for desktop application development, fully GPU-accelerated with a rendering ... to be the fastest charting library in the world for desktop and web." says Pasi Tuomainen, LightningChart CEO. ... 続きを読む この製品についてさらに結果を表示します。
機能: Smith Charts allow simultaneous visualization of multiple parameters, like impedance, admittance, ... in close. Data and grid clipping to graph area. You can show data also on outside of the graph. ... 続きを読む
リリースノート: Includes new DataCursor features for automated data tracking in the chart. DataCursor: new feature ... for automated data tracking in the chart. Now, all the ViewXY series can be explored using DataCursor. ... be added to the application layout (grid, panel) as well as to the main Chart (XY). All the data from ... 続きを読む

説明: Components: Chart- Telerik UI for Xamarin Charts includes a vast number of chart and graph kinds, as well ... as series, that allow you to view data using native Desktop, iOS, and Android standards. Different chart ... and graph formats, such as Line, Area, and Spline Area, can be used to compare sets of data using horizontal ... 続きを読む この製品についてさらに結果を表示します。
説明: Components: Chart- Telerik UI for Xamarin Charts includes a vast number of chart and graph kinds, as well as ... series, that allow you to view data using native Desktop, iOS, and Android standards. Different chart and ... graph formats, such as Line, Area, and Spline Area, can be used to compare sets of data using horizontal ... 続きを読む
スクリーンショット: The Xamarin Chart control features a large collection of chart series. You can compare sets ... of data with horizontal and vertical Bar Charts. 0 ... 続きを読む

説明: and relationship charts and graphs. Its basic types of objects- boxes, tables, and arrows- can be grouped ... Workflow processes Object hierarchies and relationships Graphs and networks Entity-relationship (ER) / ... Organizational charts XML documents Classification hierarchies The software has been tested with Visual Studio ... 続きを読む この製品についてさらに結果を表示します。
説明: .NET Compact Frameworkでフローチャート作成アプリケーションを開発 PocketChart は、ワークフローおよび、フローチャート、ネットワーク、プロセス、データベースERダイアグラム、構造化、階層と関係のチャートとグラフに関する、作成と運用を支援します。 オブジェクトの基本的なタイプである、ボックス/テーブル/アローは、グループ化と相互のアタッチが可能であり、また、複雑な構造への結合にも対応します。 そのコントロールは、カスタムなシェイプの作成のために、70 種類以上の定義済みのボックス/テーブル/アローを含みます。PocketChart は、Visual Studio ... 続きを読む
価格: PocketChart V2.0 Each license includes a free 12-month Upgrade Subscription 1 Developer License Our Part No: 515336-1090120 4 Developer License Our Part No: 515336-1090122 8 Developer License Our Part No: 515336-1090130 1 Site-wide License (An unlimited number of developers at a single physical ... 続きを読む

説明: with 64-bit support. Chart Controls Create sophisticated charts and graphs with fast, real-time tracking ... charting tool that allows you to develop charts or graphs and serve them as JPEG or PNG files to any ... The ASP web server performs the chart creation and sends the completed charts and graphs to the browser. ... 続きを読む この製品についてさらに結果を表示します。
説明: へのエクスポートなどが含まれます。 ComponentOne WebChart (Chart を含む) ブラウザに依存しない、ダイナミックなチャートを Active Server Page (ASP) 用に作成 ... 続きを読む
スクリーンショット: Create browser-independent, dynamic charts for Active Server Pages (ASP) and VB Applications using ... ComponentOne WebChart or ComponentOne Chart ... 続きを読む

説明: a complete collection of charts and graphs for professional data visualization. It also comes with advanced ... to generate a wide array of charts for your browser based applications. jChartFX Plus Features Adaptive- ... you customize virtually any chart element. Browsers- jChartFX Plus is a browser-based charting engine ... 続きを読む この製品についてさらに結果を表示します。
説明: customize virtually any chart element. Browsers- jChartFX Plus is a browser-based charting engine that takes ... Chart Types Bar Charts Stacked Bar Charts 3D Bar Charts Area Charts Line and Stripe Charts Pie and ... 続きを読む
価格: jChartFX Plus- Development License + Support Development License Only, No Deployment, 1 Year Technical Support subscription included. Development License + Support Mfr. Part No: JCFX70DS Our Part No: 545731-1342771 jChartFX Plus- Single-Domain License Deployment for a Single Domain (Subdomains ... 続きを読む

仕様: Mobile ListView True DBGrid データ視覚化 【Enterprise限定機能】Financial Chart Bullet Graph Chart Chart ... 3D FlexChart FlexPie GanttView Gauges HTML Charts Linear Gauge Maps OrgChart RadialGauge Sparkline TreeMap ... 続きを読む この製品についてさらに結果を表示します。
仕様: ListBox Mobile ListView True DBGrid データ視覚化 【Enterprise限定機能】Financial Chart Bullet Graph Chart Chart3 ... 続きを読む
カスタマーレビュー: 5 Japan ... 続きを読む