Vizuly / Janus Systems - ベストセラー商品
Create highly customized and unique data visualizations.
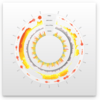
Corona Chart - This radial chart provides angular and curved radial area line curves and supports both an overlap and stacked layout. It also features over a dozen different dynamic styles and comes bundled with an easy to use test container that demonstrates seven uniquely styled themes.
-
説明:
アプリケーションにOutlook風のインターフェイスを追加可能。 Janus WinForms Controls Suite は、ComponentSourceにおけるベストセラーである、Janus Systems が提供する100%の.NETマネージドコードによるコンポーネントスイートです。このスイートに含まれるのは、Janus GridEX for.NET (Outlook Grid)、Janus Schedule for.NET (Outlook Calendar View)、Janus ...
続きを読む
-
説明:
Visual Studio(Windowsフォーム)環境内でデータ操作用ツールを開発 Janus GridEX for.NET は、データベースに直接接続される、全面的に編集可能なデータ認識型コンポーネントです。 このコントロールは、高度なデータ操作が実行できるように、独自のデータ バインディング機構を実装しています。 Janus GridEX for.NET は、グループ化機能やソート機能を犠牲にしなくてもあらゆるフォーマットのデータを管理できるように、強力なアンバウンド モードも備えています ...
続きを読む
-
説明:
便利なデータ連結型と非連結型グリッドをアプリケーションに追加 Janus GridEX 2000 により、タブ、ボタン バー、ツール チップなどをすべて備えた、Microsoft Outlook に似たユーザー インターフェイスを作成できます。 ディスクへ、あるいはインターネット上のサーバーからグリッドのレイアウト全体を動的にロードおよび保存する機能により、効果的なユーザー インターフェイスを作成できます。 Janus GridEX 2000 には、多言語ソート機能が組み込まれています。Data ...
続きを読む
-
説明:
.NETのアプリケーション用ユーザーインターフェイスコントロール Janus UI Controls for Microsoft.NET は、Microsoft.NET Windows Forms アプリケーションに最新の外観をもたらすように設計されたユーザー インターフェイス コントロールからなる包括的なツールキットです。ドッキング、ツールバー、タブ、エクスプローラ風の操作性、ボタンなどあらゆる形式のユーザー インターフェイスを処理する幅広いコンポーネントを備えています。Janus UI コントロールは ...
続きを読む
-
説明:
A radial line and area layout visualization. Vizuly Corona is a radial chart that provides angular and curved radial area line curves and supports both an overlap and stacked layout. It also features over a dozen different dynamic styles and comes bundled ...
続きを読む
-
説明:
Represent transactional relationships from a specified number of sources to a variable number of targets. Vizuly Halo uses several different data visualization techniques to represent transactional relationships from a specified number of sources to a ...
続きを読む
-
説明:
Represent cartesian x/y data within a radial plot. Vizuly Radial Bar is designed to represent cartesian x/y data within a radial plot. It supports both clustered and stacked radial bars Use the interactive style explorer on the left to view different ...
続きを読む
-
説明:
Easily display multi-variate time series information. Vizuly Ring Chart lets you easily display multi-variate time series information. Due to its radial form factor, you can display 3 times the information for a given screen width than you could with a ...
続きを読む
-
説明:
Add stacked and clustered bar charts to your JavaScript apps. Vizuly Bar Chart supports both stacked and clustered layout options, as well as over 2 dozen different dynamic styles. It also comes bundled with a test container and examples of different ...
続きを読む
-
説明:
Add stacked and clustered column charts to your JavaScript apps. Vizuly Column Chart supports both stacked and clustered layout options, as well as over 2 dozen different dynamic styles. It also comes bundled with a test container and examples of ...
続きを読む


