Visual Studio .NET 2002/2003 / MindFusion Group / Advanced Software Engineering / IDERA

  1. スクリーンショット: Chart Director includes many chart types like Pie, donut, bar, line, spline, step, trend, curve-fitting, area, scatter, bubble, box-whisker, contour, heat map, surface, vector, finance, gantt, polar, radar, rose, pyramid, funnel, etc. ChartDirector also ... 続きを読む この製品についてさらに結果を表示します。

  2. スクリーンショット: Chart Director includes many chart types like Pie, donut, bar, line, spline, step, trend, curve-fitting, area, scatter, bubble, box-whisker, contour, heat map, surface, vector, finance, gantt, polar, radar, rose, pyramid, funnel, etc. ChartDirector also ... 続きを読む

  3. スクリーンショット: Producing charts requires just a few lines of code. Comprehensive documentation and numerous sample programs are included. ... 続きを読む

  4. $$$ | 購入

    スクリーンショット: This traffic Diagram screenshot shows boxes containing metafile images. Boxes can be rotated interactively by dragging their round rotation handle. ... 続きを読む この製品についてさらに結果を表示します。

  5. スクリーンショット: Box-Objects can hold images, text or both. The boxes shown in the screenshot display icons representing network nodes. Hierarchical grouping is shown too. ... 続きを読む

  6. スクリーンショット: Use Decorated tables to display diagram entities. Tables have anchor points associated with each row, defining where incoming and outgoing connections dock to tables. ... 続きを読む

  7. $$$ | 購入

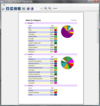
    スクリーンショット: MindFusion Reporting includes advanced features like scroll/ zoom / print / reports preview or a a Build in Charting Component with Wizard. ... 続きを読む この製品についてさらに結果を表示します。

  8. スクリーンショット: MindFusion's professional reporting tool features a complete list of properties, methods and events that let you create advanced business reports in the style and format you want them. ... 続きを読む

  9. スクリーンショット: A report Designer automates customizing the report's appearance. Placement of any WinForms control as a report element is also possible. ... 続きを読む

  10. スクリーンショット: FlowChartX Professional can automatically route arrows in the shortest way they reach from their source to their destination without crossing any diagram nodes. ... 続きを読む この製品についてさらに結果を表示します。

  11. スクリーンショット: This traffic Diagram screenshot shows boxes containing metafile images. Boxes can be rotated interactively by dragging their round rotation handle. ... 続きを読む

  12. スクリーンショット: Box-Objects can hold images, text or both. The boxes shown in the screenshot display icons representing network nodes. Hierarchical grouping is shown too. ... 続きを読む