公式サプライヤー
公式および認定ディストリビューターとして200社以上の開発元から正規ライセンスを直接ご提供いたします。
当社のすべてのブランドをご覧ください。

スクリーンショット: The Seven Segment Integer control is a seven-segment display used for displaying Integer values. If the Value overflows the display in the positive direction, then up arrows will be shown. If the Value overflows the display in the negative direction, then ... 続きを読む この製品についてさらに結果を表示します。
スクリーンショット: The Seven Segment Integer control is a seven-segment display used for displaying Integer values. If the Value overflows the display in the positive direction, then up arrows will be shown. If the Value overflows the display in the negative direction, then ... 続きを読む
スクリーンショット: The Phone Pad Control is a simple numeric keypad control with mouse control support. Input is processed in your application by using the OnKeyClick event. ... 続きを読む

スクリーンショット: With Iocomp.NET WinForms Plot Pack you can create professional real-time plotting/charting type applications in.NET development environments. ... 続きを読む この製品についてさらに結果を表示します。
スクリーンショット: With Iocomp.NET WinForms Plot Pack you can create professional real-time plotting/charting type applications in.NET development environments. ... 続きを読む
スクリーンショット: Iocomp.NET WinForms Plot Pack lets you zoom & scroll while plotting. ... 続きを読む

スクリーンショット: This traffic Diagram screenshot shows boxes containing metafile images. Boxes can be rotated interactively by dragging their round rotation handle. ... 続きを読む この製品についてさらに結果を表示します。
スクリーンショット: Box-Objects can hold images, text or both. The boxes shown in the screenshot display icons representing network nodes. Hierarchical grouping is shown too. ... 続きを読む
スクリーンショット: Use Decorated tables to display diagram entities. Tables have anchor points associated with each row, defining where incoming and outgoing connections dock to tables. ... 続きを読む

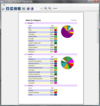
スクリーンショット: MindFusion Reporting includes advanced features like scroll/ zoom / print / reports preview or a a Build in Charting Component with Wizard. ... 続きを読む この製品についてさらに結果を表示します。
スクリーンショット: MindFusion's professional reporting tool features a complete list of properties, methods and events that let you create advanced business reports in the style and format you want them. ... 続きを読む
スクリーンショット: A report Designer automates customizing the report's appearance. Placement of any WinForms control as a report element is also possible. ... 続きを読む

スクリーンショット: FlowChartX Professional can automatically route arrows in the shortest way they reach from their source to their destination without crossing any diagram nodes. ... 続きを読む この製品についてさらに結果を表示します。
スクリーンショット: This traffic Diagram screenshot shows boxes containing metafile images. Boxes can be rotated interactively by dragging their round rotation handle. ... 続きを読む
スクリーンショット: Box-Objects can hold images, text or both. The boxes shown in the screenshot display icons representing network nodes. Hierarchical grouping is shown too. ... 続きを読む