Vizuly Professional(英語版)
JavaScriptアプリに多種多様なグラフを追加
- Corona、Halo、Radial Bar、Weighted Treeなど幅広い種類のグラフコンポーネントを収録
- React、Angular、Vue.jsフレームワークのラッパーを使用することも、純粋なJavaScriptとして使用することも可能
- 簡単にカスタマイズして美しいグラフを作成できるように一から設計されたコンポーネント

サポート: ComponentOne Support is offered in Standard or Platinum levels. Standard Support Includes: Access to hotfix builds ComponentOne Blogs ComponentOne Forums Access to 3 major releases per year Online Support Email Project for Analysis Platinum Support Adds: ... 続きを読む

サポート: サブスクリプション ComponentOne Studio のサブスクリプションは新しいUIやUX、プラットフォーム、Web 技術などをいち早く取り入れることをモットーにしています。新しい環境や技術への対応が早いため、めまぐるしく変わるビジネスモデルに合わせた柔軟なIT システムを低コストで開発できます。サブスクリプション契約期間中の無償バージョンアップや日本語によるE-mail技術サポートを無制限に受けることができます。ComponentOne Studioシリーズは ... 続きを読む

サポート: ComponentOne Support is offered in Standard or Platinum levels. Standard Support Includes: Access to hotfix builds ComponentOne Blogs ComponentOne Forums Access to 3 major releases per year Online Support Email Project for Analysis Platinum Support Adds: ... 続きを読む

説明: Create animated and interactive charts with hundreds of thousands of data records. ZingChart includes over 50+ built-in chart types and modules that feature interaction with data points and zooming into particular segments. The ZingChart library provides ... 続きを読む

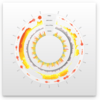
説明: A radial line and area layout visualization. Vizuly Corona is a radial chart that provides angular and curved radial area line curves and supports both an overlap and stacked layout. It also features over a dozen different dynamic styles and comes bundled ... 続きを読む

説明: Represent transactional relationships from a specified number of sources to a variable number of targets. Vizuly Halo uses several different data visualization techniques to represent transactional relationships from a specified number of sources to a ... 続きを読む

説明: Represent cartesian x/y data within a radial plot. Vizuly Radial Bar is designed to represent cartesian x/y data within a radial plot. It supports both clustered and stacked radial bars Use the interactive style explorer on the left to view different ... 続きを読む

説明: Easily display multi-variate time series information. Vizuly Ring Chart lets you easily display multi-variate time series information. Due to its radial form factor, you can display 3 times the information for a given screen width than you could with a ... 続きを読む

説明: Add stacked and clustered bar charts to your JavaScript apps. Vizuly Bar Chart supports both stacked and clustered layout options, as well as over 2 dozen different dynamic styles. It also comes bundled with a test container and examples of different ... 続きを読む

説明: Add stacked and clustered column charts to your JavaScript apps. Vizuly Column Chart supports both stacked and clustered layout options, as well as over 2 dozen different dynamic styles. It also comes bundled with a test container and examples of ... 続きを読む