.NETよびJavaScriptのグラフ 比較
ベストセラーのグラフを数分で評価及び購入します。
特に、機能、フラットフォーム、価格別に製品を開発者が検討リストに入れることができるように設計されています。

説明: TMS Software すべてのVCLコンポーネントを提供。 TMS VCL Subscriptionは、Delphi & C++Builder 対応のすべてのTMS Software VCLをご提供します。また、2年間のVCLの主なコンポーネントの新バージョンを提供して、TMS Software社からのプライオリティーサポートが受けられます。TMS VCL Subscriptionには300種類以上のVCLコンポーネントを含んでいるTMS Component Packを初め、TMS ... 続きを読む

説明: Delphi & C++Builder 対応のチャートコンポーネント。 TMS Advanced Chartsは、フルマネージドチャートをプロジェクトに加えるという魅力が提供されます。その利用は容易であり、柔軟であり、また、直ちに組み立てて実行できるものになります。TMS Advanced Chartsはアプリケーションに魅力的なチャートを加えるために、TAdvChartView & TDBAdvChartViewを大限に活用します。また、アンチエイリアシングおよび、アルファブレンディング ... 続きを読む

説明: A radial line and area layout visualization. Vizuly Corona is a radial chart that provides angular and curved radial area line curves and supports both an overlap and stacked layout. It also features over a dozen different dynamic styles and comes bundled ... 続きを読む

説明: Represent transactional relationships from a specified number of sources to a variable number of targets. Vizuly Halo uses several different data visualization techniques to represent transactional relationships from a specified number of sources to a ... 続きを読む

説明: Represent cartesian x/y data within a radial plot. Vizuly Radial Bar is designed to represent cartesian x/y data within a radial plot. It supports both clustered and stacked radial bars Use the interactive style explorer on the left to view different ... 続きを読む
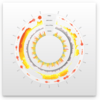
説明: Easily display multi-variate time series information. Vizuly Ring Chart lets you easily display multi-variate time series information. Due to its radial form factor, you can display 3 times the information for a given screen width than you could with a ... 続きを読む
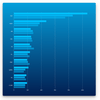
説明: Add stacked and clustered bar charts to your JavaScript apps. Vizuly Bar Chart supports both stacked and clustered layout options, as well as over 2 dozen different dynamic styles. It also comes bundled with a test container and examples of different ... 続きを読む
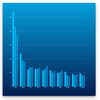
説明: Add stacked and clustered column charts to your JavaScript apps. Vizuly Column Chart supports both stacked and clustered layout options, as well as over 2 dozen different dynamic styles. It also comes bundled with a test container and examples of ... 続きを読む
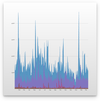
説明: Add line and area charts to your JavaScript apps. Vizuly Line Area Chart supports both line and area plots in several different layout options. It also comes bundled with a test container demonstrating the various chart properties and different style ... 続きを読む
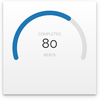
説明: Show numeric values within a minimum and maximum range. Vizuly Radial Progress is designed to show numeric values within a minimum and maximum range. It can also show when a value has exceeded the maximum threshold. This chart supports a variable range of ... 続きを読む