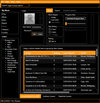
Xceed DataGrid for WPF (英語版)
WPF用の優れたパフォーマンスかつ機能満載のグリッド
- スムーズなスクロールとデータのすばやい可視化
- 優れたインプレース編集機能を搭載
- 階層構造の概要ビューと詳細ビュー、2次元と3次元表示、印刷プレビューなど

スクリーンショット: Data binding 続きを読む この製品についてさらに結果を表示します。
スクリーンショット: Hierarchical master/detail 続きを読む
スクリーンショット: Rich in-place editing 続きを読む

スクリーンショット: Xceed Editors for WinForms 続きを読む この製品についてさらに結果を表示します。
スクリーンショット: Xceed Toolkit Plus for WPF 続きを読む
スクリーンショット: Xceed DataGrid for WPF 続きを読む

スクリーンショット: Metro Dark Theme 続きを読む この製品についてさらに結果を表示します。
スクリーンショット: Metro Light Theme 続きを読む
スクリーンショット: Glass Theme 続きを読む

スクリーンショット: All of the grid’s classes are inheritable and documented so developers can easily extend the grid’s functionality as needed. Sample applications demonstrating how to extend the grid are included. ... 続きを読む この製品についてさらに結果を表示します。
スクリーンショット: Configure your grid right on the form without a configuration dialog or wizard. Set up your headers & footers, columns, grouping, master/detail views, insertion rows, styles, etc. ... 続きを読む
スクリーンショット: Performance enhancements through cell UI virtualization, for shorter load times and decreased memory use. With a reference grid containing 10 columns and 100,000 data rows, load time is very fast, and memory use is minimal. ... 続きを読む

スクリーンショット: The GridLayout 3D sample has two samples in one. On the left you can move the sliders to view how items can be placed and moved within the 3D Space. On the right you can see multpile sphericle 3D models all rendered as the grid rotates. ... 続きを読む この製品についてさらに結果を表示します。
スクリーンショット: The GridLayout 3D sample has two samples in one. On the left you can move the sliders to view how items can be placed and moved within the 3D Space. On the right you can see multpile sphericle 3D models all rendered as the grid rotates. ... 続きを読む
スクリーンショット: 3D Cylinders placed in a canvas can be used to model complex data as shown in this sample. By refreshing the data you can view the various exit and entry animations. Those are Penner animations in 3D. ... 続きを読む

スクリーンショット: A look at Carousel3D included in the Mixer sample viewer that ships with every version of Blendables. In addition to viewing samples users can access the source of the samples ... 続きを読む この製品についてさらに結果を表示します。
スクリーンショット: A design time experience was created inside of Microsoft Expression Blend to put everything the blendables user needs right at their fingertips. ... 続きを読む
スクリーンショット: TimelinePanel makes it easy to create compelling data visualizations that emphasize the chronological nature of a data set. Simply drop it into any application, set a handful of properties and watch as elements get arranged in time and space ... 続きを読む

スクリーンショット: Layout to Layout animation is by far the most valuable feature of the Blendables Layout Mix. Included are all of the standard Penner animations to describe the life-like feel when switching between layouts. ... 続きを読む この製品についてさらに結果を表示します。
スクリーンショット: With the Blendables Layout Mix you can create a 3D like experience without having to do true 3D. The Layout Mix Carousel control allows for a wide range of customization as evident in the Carousel Properties ... 続きを読む
スクリーンショット: The radial canvas allows for placement of objects in a circular fashion. Like all layouts in the Layout Mix adding, removing and rearranging objects within this canvas can be animated using standard Penner Animations. ... 続きを読む

スクリーンショット: Xceed Chart for ASP.NET provides ASP.NET support of image maps, image response, server-side events with post back, persistent states, streaming, script injection, browser detection and automatic temporary file cleanup, out-of-process rendering, and more. ... 続きを読む この製品についてさらに結果を表示します。
スクリーンショット: Xceed Chart for ASP.NET can be used in an ASPX page with no code behind. This feature can be useful when you have to port legacy ASP applications to ASP.NET ... 続きを読む
スクリーンショット: Xceed Chart for ASP.NET can synchronize the axis position with another axis value ... 続きを読む

スクリーンショット: Screenshot showing a Polar Chart created with Xceed Chart for.NET. Xceed Chart for.NET uses OpenGL (present on most graphics cards) for fast, real-time rendering of charts, with GDI+ as a fallback. Xceed Chart for.NET supports 14 major 2D/3D chart types, ... 続きを読む この製品についてさらに結果を表示します。
スクリーンショット: Several Financial charts included. Stock Series includes Candle, Stick and Date Time Stock. ... 続きを読む
スクリーンショット: Real Time data plotting supported. The current point is marked with a const line. ... 続きを読む

スクリーンショット: Screenshot of Xceed DataGrid for Silverlight 続きを読む この製品についてさらに結果を表示します。
スクリーンショット: Screenshot of Xceed DataGrid for Silverlight 続きを読む
スクリーンショット: Screenshot of Xceed DataGrid for Silverlight 続きを読む