公式サプライヤー
公式および認定ディストリビューターとして200社以上の開発元から正規ライセンスを直接ご提供いたします。
当社のすべてのブランドをご覧ください。

リリースノート: App Builderのさらなる機能拡張と本番用コード生成 Infragistics App Builder- グリッド列テンプレートと Figma 自動レイアウト機能を追加 Infragistics Ignite UI- App Builder に新しい Blazor ComboBox コンポーネントとグリッド列テンプレートを追加 Infragistics Ignite UI for Angular- Angular 16 のサポートを追加し、ComboBox コンポーネントの設計を改善 ... 続きを読む

説明: Fast and accurate 1D and 2D barcodes. TX Barcode.NET for Windows Forms has been specifically designed for integrating barcodes into documents, such as reports, invoices and mail merge templates. It is optimized for printing and on-screen scanning. You can ... 続きを読む

説明: Fast and accurate 1D and 2D barcodes. TX Barcode.NET for WPF has been specifically designed for integrating barcodes into documents, such as reports, invoices and mail merge templates. It is optimized for printing and on-screen scanning. You can create ... 続きを読む

説明: Add a server-side ASP word processing control to your classic ASP applications. TX Text Control ActiveX Server is a fully programmable word processing engine for ASP. It is not an editor like TX Text Control Professional, MS Word or Notepad, which lets ... 続きを読む

説明: Add charts and visualizations to your JavaScript apps. Vizuly Professional includes Corona, Halo, Radial Bar, Ring Chart, Weighted Tree, Geo Plot, Bar Chart, Column Chart, Line Area Chart, Radar Chart, Radial Progress, Scatter Plot, Sunburst, Tree Map, ... 続きを読む
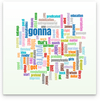
説明: Add Word Clouds to your JavaScript apps. Vizuly Word Cloud is a unique way to represent the occurrence rate of words within a given text stream. This visualization supports an exclusion list that will ignore common pronouns, profanity, or any words you ... 続きを読む
説明: Add Venn Diagram charts to your JavaScript apps. Vizuly Venn Diagram shows all possible logical relations between a finite collection of different sets. This chart depicts elements as points in the plane, and sets as regions inside closed curves. A Venn ... 続きを読む
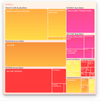
説明: Add Tree Map charts to your JavaScript apps. Vizuly Tree Map visualizes hierarchical data in nested rectangular plots where the area of each rectangle is bound to a data property you can set. This TreeMap also supports the ability to drill down/up, in ... 続きを読む
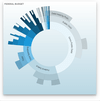
説明: Adds Sunburst charts to your JavaScript apps. Vizuly Sunburst is designed to represent hierarchical data in a radial plot. It supports drill down and drill up capabilities by allowing the user to collapse and expand segments of the sunburst when they ... 続きを読む
説明: Add Scatter Plot charts to your JavaScript apps. Vizuly Scatter Plot shows 3 dimensions of data at once by plotting values along both the x and y axis as well as the radius of the plot itself. Each plot can be colored and styled dynamically based on your ... 続きを読む