


公式サプライヤー
公式および認定ディストリビューターとして200社以上の開発元から正規ライセンスを直接ご提供いたします。
当社のすべてのブランドをご覧ください。
英語で読み続ける:
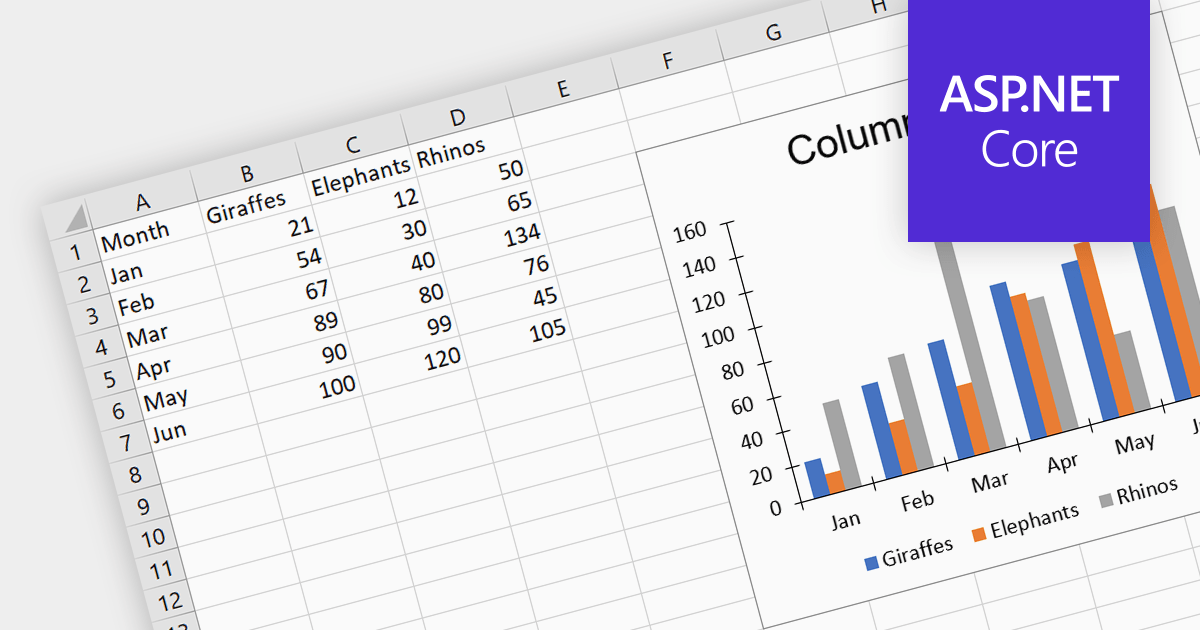
Charts help to transform complex numerical spreadsheet data into easily understandable graphical representations. They make it easier to identify patterns, trends, and relationships within the data, enabling faster comprehension and identification of key insights. This visual approach enhances communication and promotes informed decision-making. Charts can be particularly useful for presentations and performance tracking, allowing for effective data sharing and dissemination of insights.
Several ASP.NET Core spreadsheet controls offer charting support including:
Alternatively, many spreadsheet controls are available as part of multi-function suites:
For an in-depth analysis of features and price, visit our comparison of ASP.NET Core spreadsheets.
電話: (888) 850 9911
Fax: +1 770 250 6199


