


公式サプライヤー
公式および認定ディストリビューターとして200社以上の開発元から正規ライセンスを直接ご提供いたします。
当社のすべてのブランドをご覧ください。
英語で読み続ける:
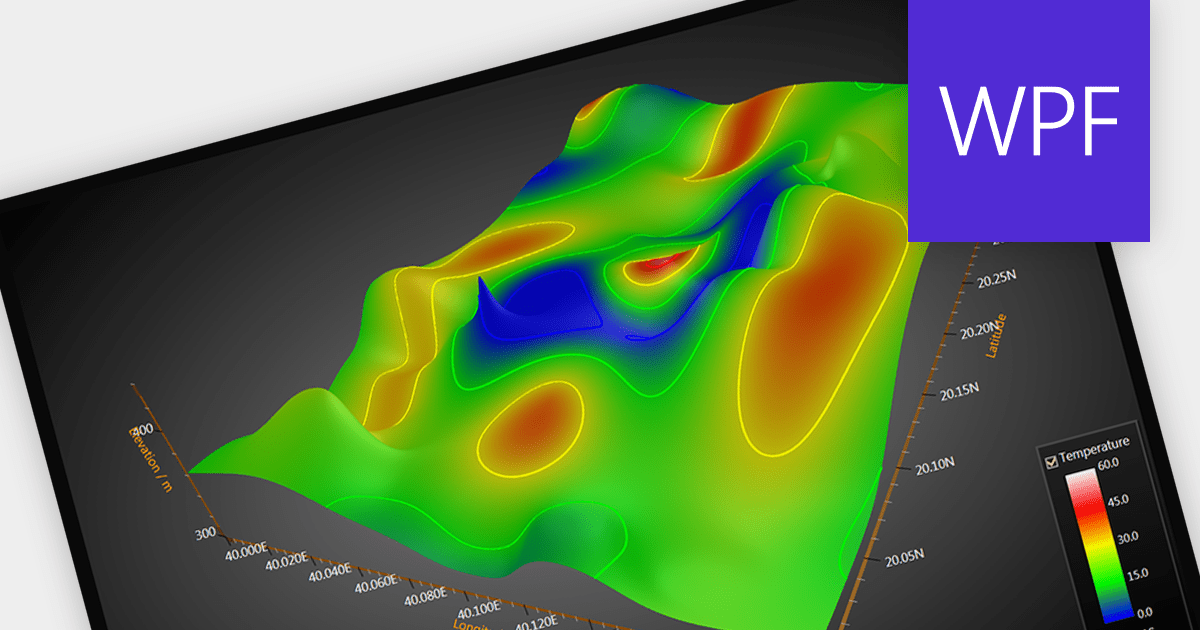
Surface charts are graphical representations that depict three-dimensional data in a two-dimensional format, typically using a grid of rows and columns. These charts provide a visual representation of how two independent variables (typically represented on the X and Y axes) influence a dependent variable, represented by the height or color of the surface. The primary benefit of surface charts lies in their ability to reveal complex relationships within datasets, making it easier for analysts and decision-makers to grasp patterns and trends. Surface charts offer a valuable tool for analyzing data in fields such as scientific research, engineering, finance, and various other domains.
Several WPF chart controls offer Surface charts including:
For an in-depth analysis of features and price, visit our WPF chart controls comparison.
電話: (888) 850 9911
Fax: +1 770 250 6199


