


公式サプライヤー
公式および認定ディストリビューターとして200社以上の開発元から正規ライセンスを直接ご提供いたします。
当社のすべてのブランドをご覧ください。
英語で読み続ける:
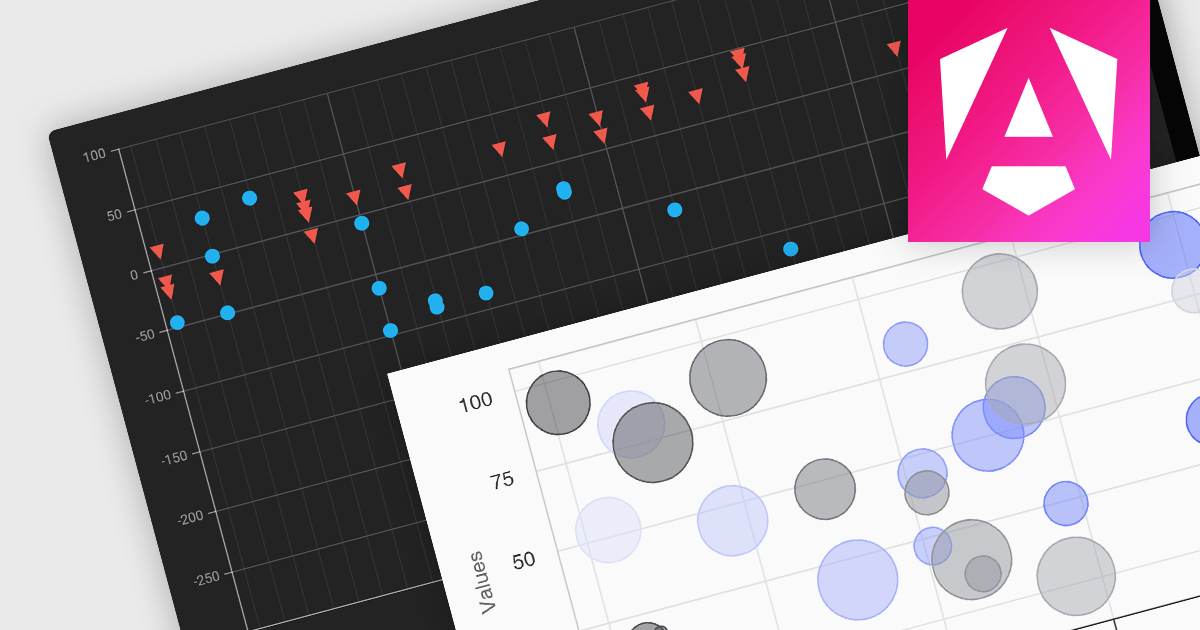
Scatter and bubble charts are used to display data points on a two-dimensional graph. While scatter charts use dots to represent data points, bubble charts add an additional dimension by varying the dot size, often representing volume or intensity. These charts are useful for showing relationships between variables and for identifying patterns or trends in data.
Several Angular chart controls offer scatter and bubble charts including:
For an in-depth analysis of features and price, visit our Angular chart controls comparison.
電話: (888) 850 9911
Fax: +1 770 250 6199


