


公式サプライヤー
公式および認定ディストリビューターとして200社以上の開発元から正規ライセンスを直接ご提供いたします。
当社のすべてのブランドをご覧ください。
英語で読み続ける:
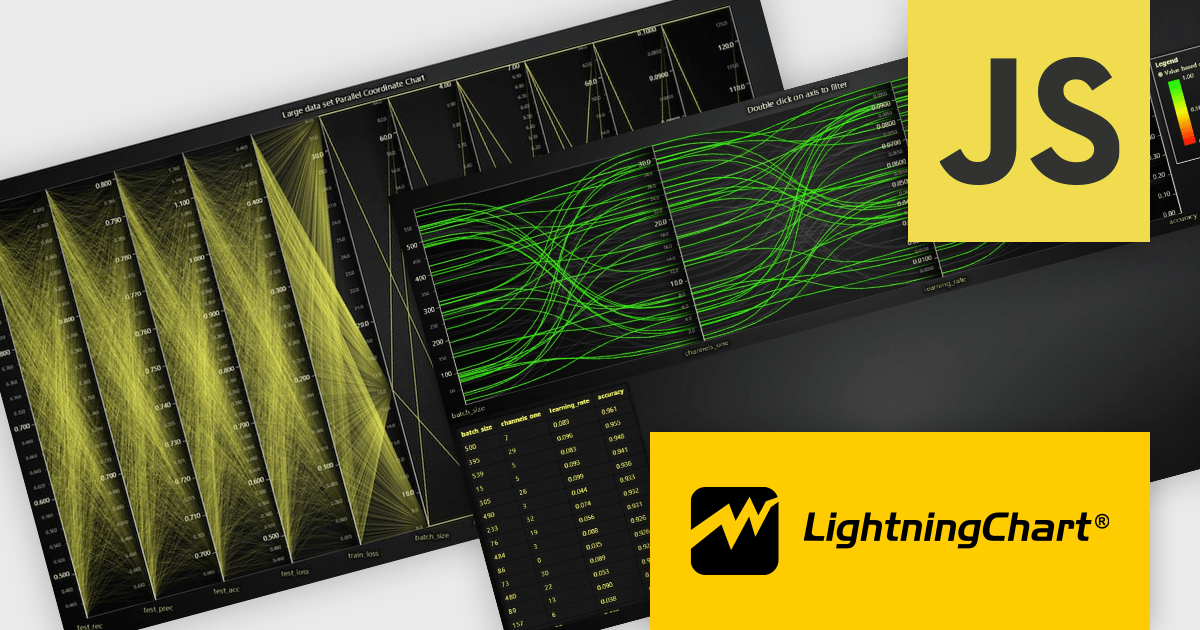
LightningChart JS is a high-performance JavaScript charting library optimized for real-time data visualization. Leveraging WebGL and GPU acceleration, it enables developers to create interactive, complex charts capable of handling massive datasets with high refresh rates. Ideal for applications demanding rapid data updates and smooth interactions, LightningChart JS provides a robust API for customization and integration into web-based projects.
The LightningChart JS v6.1 update introduces the Parallel Coordinate Chart, a powerful tool designed for advanced data visualization and exploration. It allows developers to work with large-scale datasets, supporting over 100,000 series and multiple axes while maintaining high performance. This chart type is optimized for real-time data input, enabling smooth updates at high stream rates. With features like value-based coloring, range-based highlighting, and interactive cursors, it provides an intuitive way to analyze and interpret complex data relationships, making it an essential addition for creating data-driven applications.
To see a full list of what's new in v6.1, see our release notes.
LightningChart JS is licensed based on method of deployment with options including SaaS Developer Licenses, Application Developer Licenses, and Publisher Developer Licenses. Each license is perpetual and includes 1 year subscription for technical support and software updates. See our LightningChart JS licensing page for full details.
Learn more on our LightningChart JS product page.
電話: (888) 850 9911
Fax: +1 770 250 6199


