


公式サプライヤー
公式および認定ディストリビューターとして200社以上の開発元から正規ライセンスを直接ご提供いたします。
当社のすべてのブランドをご覧ください。
英語で読み続ける:
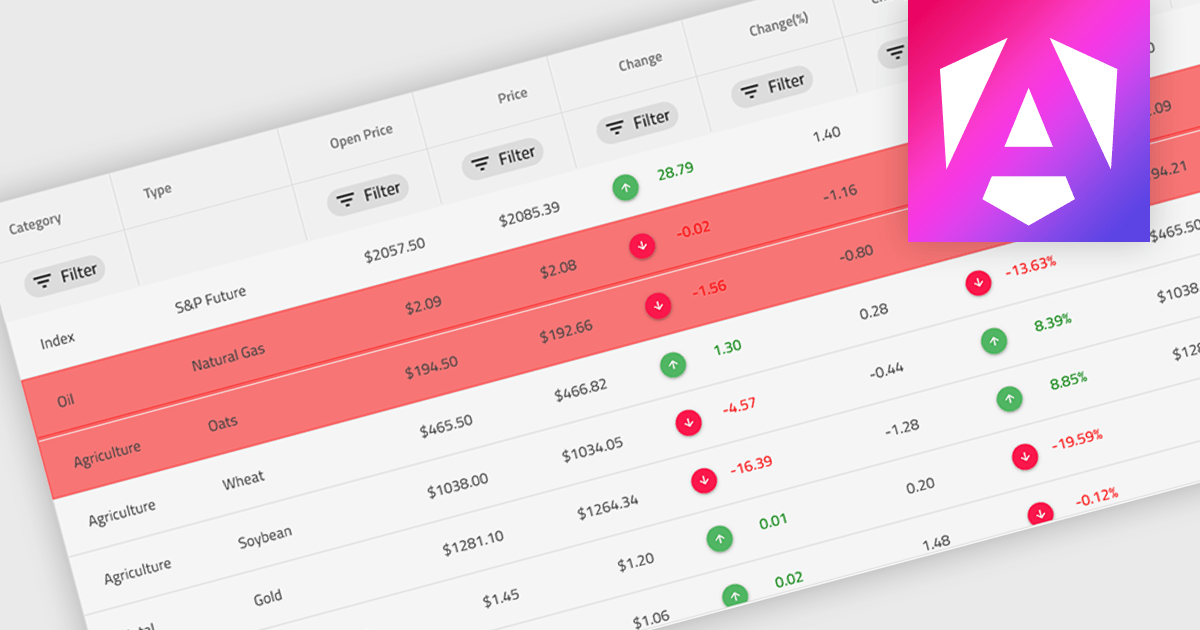
Conditional formatting in a grid refers to the dynamic application of visual styles—such as colors, icons, or font changes—to cells based on the values they contain or rules defined by the developer. This feature enables developers to visually differentiate data patterns, identify anomalies, or highlight critical values directly within a data grid without additional processing or user interaction. By presenting real-time visual cues tied to data content, conditional formatting enhances readability, supports quick analysis, and improves user decision-making, particularly in data-heavy applications where clarity and immediacy are essential.
Several Angular grid controls offer conditional formatting, including:
For an in-depth analysis of features and price, visit our comparison of Angular Grid controls.
電話: (888) 850 9911
Fax: +1 770 250 6199


