


公式サプライヤー
公式および認定ディストリビューターとして200社以上の開発元から正規ライセンスを直接ご提供いたします。
当社のすべてのブランドをご覧ください。
英語で読み続ける:
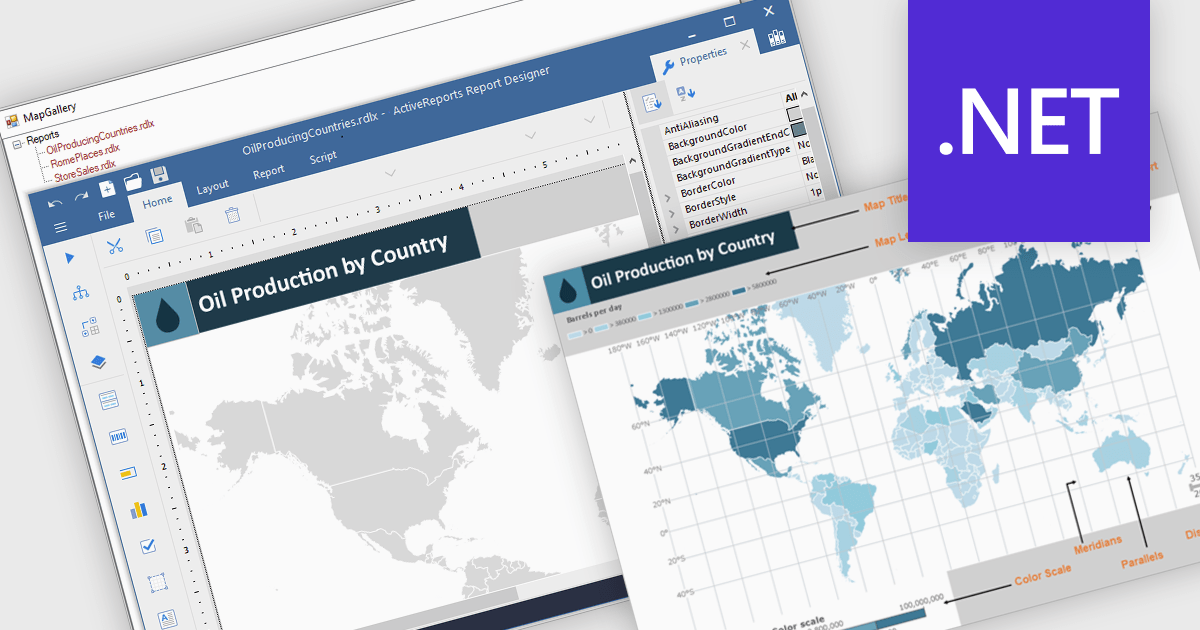
Maps in reports are visual tools that display geographic data, allowing users to see where activities, trends, or values occur across specific regions. By translating complex location-based information into clear and intuitive visuals, maps enhance understanding, highlight spatial patterns, and reveal insights that might be missed in tables or charts. This added layer of geographic context supports more informed decision-making and more compelling data storytelling. Common use cases include tracking regional sales performance, mapping customer distribution, analyzing service coverage, and presenting market expansion opportunities. Whether static or interactive, maps make reports more engaging and impactful for both technical and non-technical audiences.
Several .NET reporting controls offer maps, including:
For an in-depth analysis of features and price, visit our comparison of .NET reporting controls.
電話: (888) 850 9911
Fax: +1 770 250 6199


