


公式サプライヤー
公式および認定ディストリビューターとして200社以上の開発元から正規ライセンスを直接ご提供いたします。
当社のすべてのブランドをご覧ください。
英語で読み続ける:
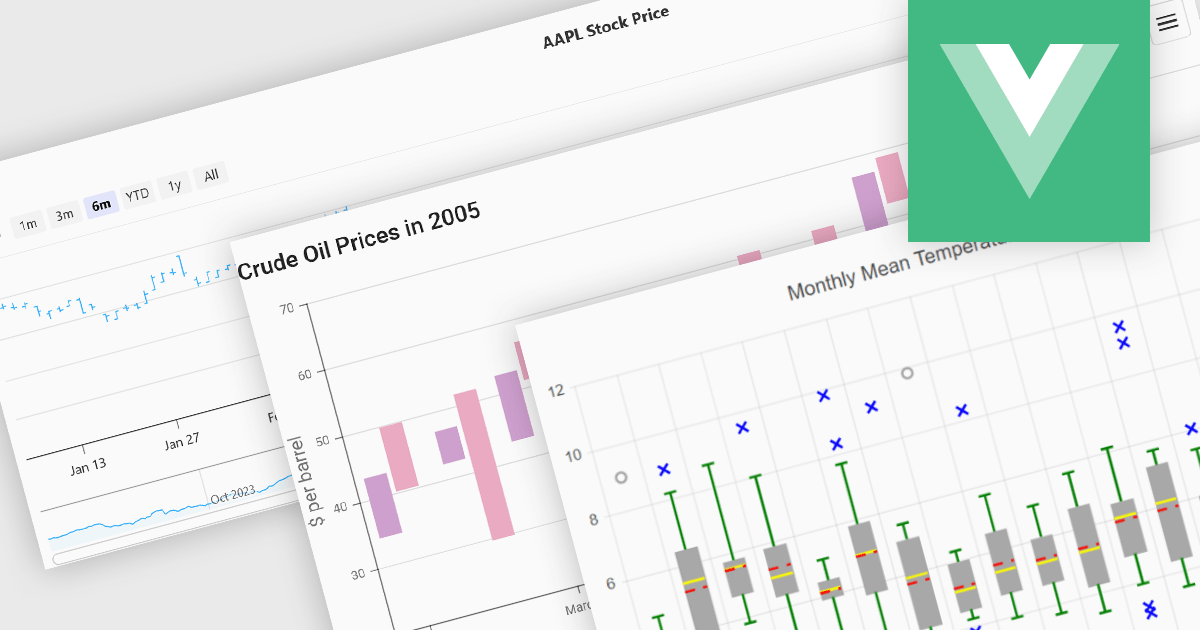
Financial chart components are used within software applications to visually represent complex financial data over time. They enable users, particularly those in trading, investment, and financial analysis, to interpret trends, compare performance, and make data-driven decisions more effectively. These components typically support a variety of chart types tailored to the unique requirements of financial datasets, allowing for granular analysis of price movements, market trends, and volatility.
Common features include:
For an in-depth analysis of features and price, visit our Vue.js Chart components comparison.
電話: (888) 850 9911
Fax: +1 770 250 6199


