グラフデータをレポート対応形式に変換

9月 24, 2025
インタラクティブなグラフを共有可能、印刷可能、埋め込み可能な形式に変換するエクスポートツールを使用して、ブラウザーを超えて視覚的な洞察を得ることが可能。

英語で読み続ける:

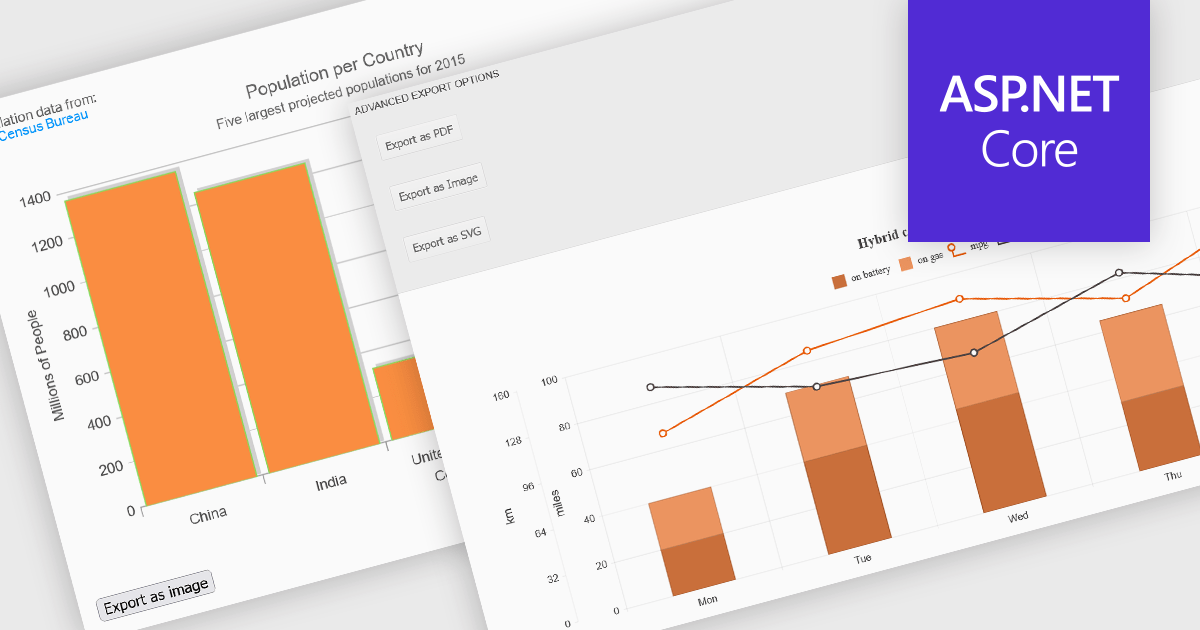
Export features in charting components allow developers and users to take visualized data beyond the browser, whether for sharing, archiving, or integrating into reports and presentations. These tools support a wide range of formats and workflows, transforming interactive charts into portable assets that can be printed, saved, or embedded in other applications. By offering export capabilities alongside dynamic charting, modern components bridge the gap between visual exploration and formal communication of data, ensuring insights can be distributed effectively in both digital and hardcopy formats.

Common features include:

  • Exporting to CSV allows users to extract the underlying data behind a chart into a structured, plain-text format suitable for spreadsheets and data processing tools.
  • Exporting to HTML enables charts to be converted into standalone HTML snippets, preserving interactivity for use in dashboards or embedded web reports.
  • Exporting to Image such as PNG or JPEG images enables easy sharing in emails, slide decks, or documents where interactivity isn't required.
  • Exporting to PDF allows charts to be included in high-fidelity, print-ready documents, useful for formal reporting or offline distribution.
  • Exporting to SVG generates resolution-independent vector graphics that can be scaled or edited in design tools.
  • Exporting to XLS/XLSX enables charts and their associated data to be embedded into Excel files, supporting deeper spreadsheet-based analysis or reporting.
  • Printing support ensures users can produce physical copies of charts, with control over layout, sizing, and page formatting.

For an in-depth analysis of features and price, visit our ASP.NET Core charting components comparison.

Explore ASP.NET Core Charting Features