


公式サプライヤー
公式および認定ディストリビューターとして200社以上の開発元から正規ライセンスを直接ご提供いたします。
当社のすべてのブランドをご覧ください。
英語で読み続ける:
Stimulsoft Reports.JS provides a robust reporting toolkit designed specifically for JavaScript applications. This library leverages a client-side architecture, offering a pure JavaScript report engine for efficient report rendering directly within web browsers. The solution includes a user-friendly report designer for building reports with various data sources and visualizations, along with a report viewer for seamless integration and display within your JavaScript applications. This eliminates the need for server-side dependencies or browser plugins, simplifying the development process for embedding powerful reporting functionalities into your web projects.
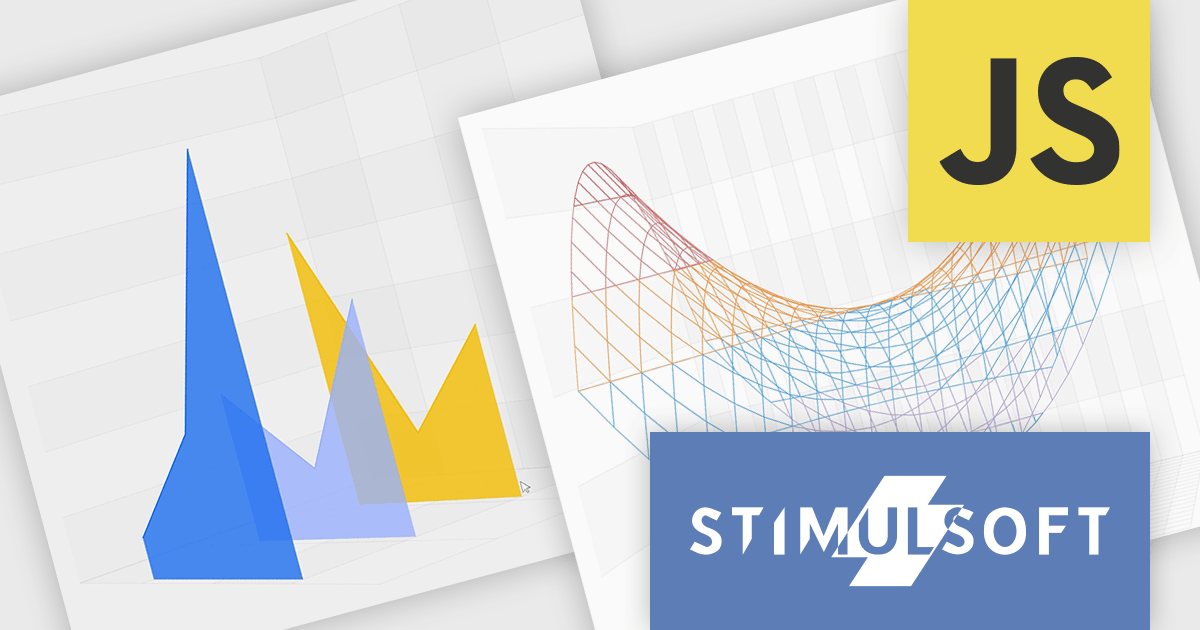
The Stimulsoft Reports.JS 2025.4.1 update introduces new 3D Surface and Area charts that enhance data visualization capabilities in reports and dashboards. These charts allow developers to represent complex data relationships with added depth and perspective, improving analytical clarity and user comprehension. By visualizing three-dimensional data and trends more effectively, developers can deliver more informative and visually engaging reporting solutions without additional complexity in implementation.
To see a full list of what's new in 2025.4.1, see our release notes.
Stimulsoft Reports.JS is licensed per developer and is available as a Perpetual license with 1 year support and maintenance. See our Stimulsoft Reports.JS licensing page for full details.
Stimulsoft Reports.JS is available individually or as part of Stimulsoft Ultimate.
電話: (888) 850 9911
Fax: +1 770 250 6199


