


公式サプライヤー
公式および認定ディストリビューターとして200社以上の開発元から正規ライセンスを直接ご提供いたします。
当社のすべてのブランドをご覧ください。
英語で読み続ける:
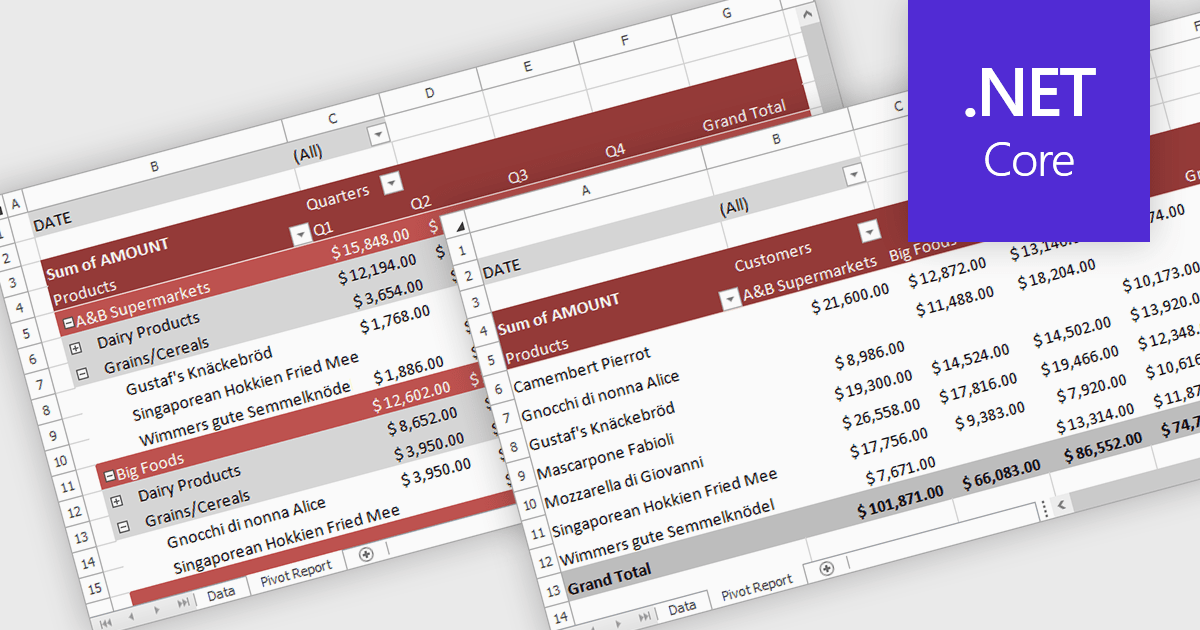
A pivot table in a spreadsheet lets you quickly summarize and explore large datasets by dynamically grouping, filtering, and aggregating data. It automatically calculates totals, averages, counts, and other metrics, reducing the need for complex formulas. This makes it easier to uncover trends, patterns, and outliers, such as comparing sales by region and product, analyzing costs by department, or tracking performance over time. By turning raw data into clear, interactive summaries, pivot tables help users make faster, more informed decisions.
Several .NET Core spreadsheet controls support pivot tables including:
For an in-depth analysis of features and price, visit our .NET Core spreadsheet controls comparison.
電話: (888) 850 9911
Fax: +1 770 250 6199


