


公式サプライヤー
公式および認定ディストリビューターとして200社以上の開発元から正規ライセンスを直接ご提供いたします。
当社のすべてのブランドをご覧ください。
英語で読み続ける:
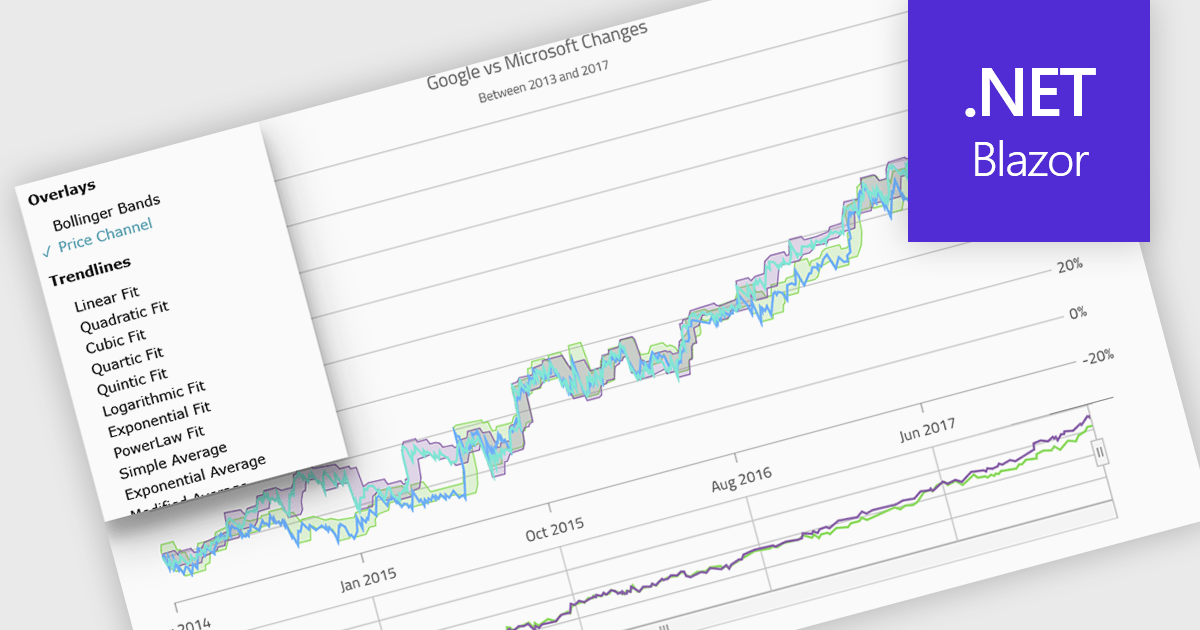
Indicators in a chart component are visual tools used to represent specific statistical or mathematical calculations directly on the chart, often to highlight trends, patterns, or key thresholds within the underlying data. Common in financial and analytical applications, indicators can include elements like moving averages, Bollinger Bands, or threshold lines. For software developers, implementing indicators provides a powerful way to enhance data interpretation by allowing users to see meaningful context and actionable insights without needing to leave the chart interface. This improves decision-making and supports more interactive and informative visualizations across a wide range of use cases.
Several .NET Blazor charting controls support indicators including:
For an in-depth analysis of features and price, visit our comparison of .NET Blazor Chart Controls.
電話: (888) 850 9911
Fax: +1 770 250 6199


