


公式サプライヤー
公式および認定ディストリビューターとして200社以上の開発元から正規ライセンスを直接ご提供いたします。
当社のすべてのブランドをご覧ください。
英語で読み続ける:
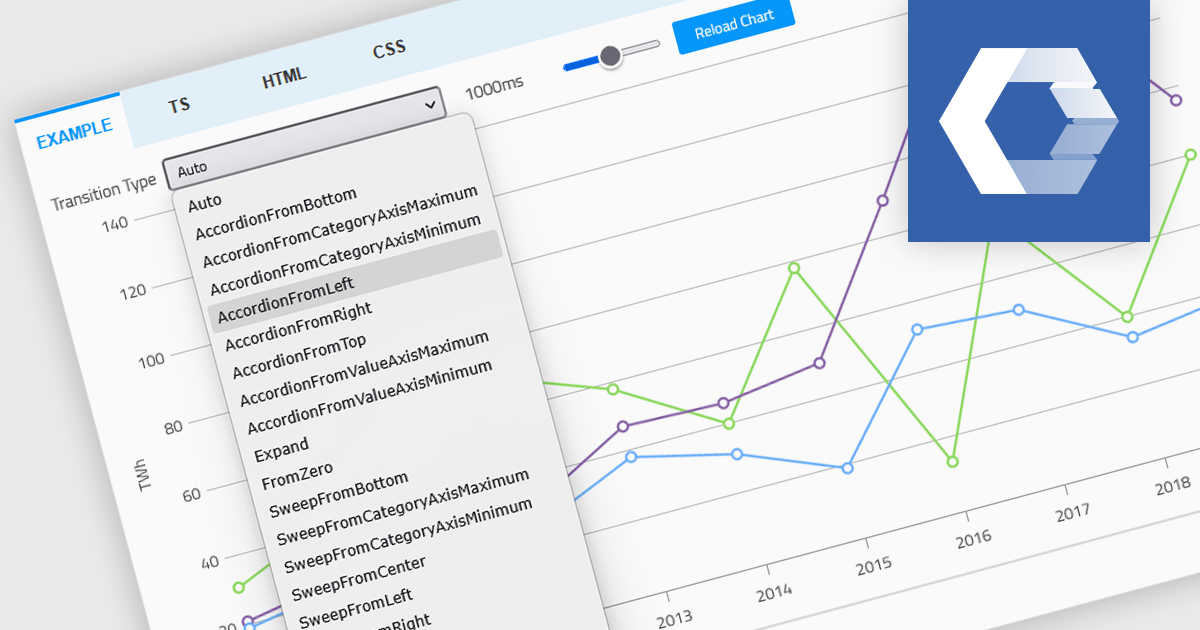
Animation in a Web Components Chart control refers to the visual transitions applied to chart elements as data is rendered, updated, or interacted with. It enhances the user experience by making changes in the data more perceptible and easier to follow, particularly when dealing with dynamic or real-time datasets. For developers, animation helps improve data readability and provides a more engaging and polished interface, especially when charts are updated frequently or involve user interaction. It also makes it easier for users to track what’s changed in the chart, even when the visuals are complex.
Several Web Components chart controls offer animation including:
For an in-depth analysis of features and price, visit our comparison of Web Components Chart Controls.
電話: (888) 850 9911
Fax: +1 770 250 6199


