


公式サプライヤー
公式および認定ディストリビューターとして200社以上の開発元から正規ライセンスを直接ご提供いたします。
当社のすべてのブランドをご覧ください。
英語で読み続ける:
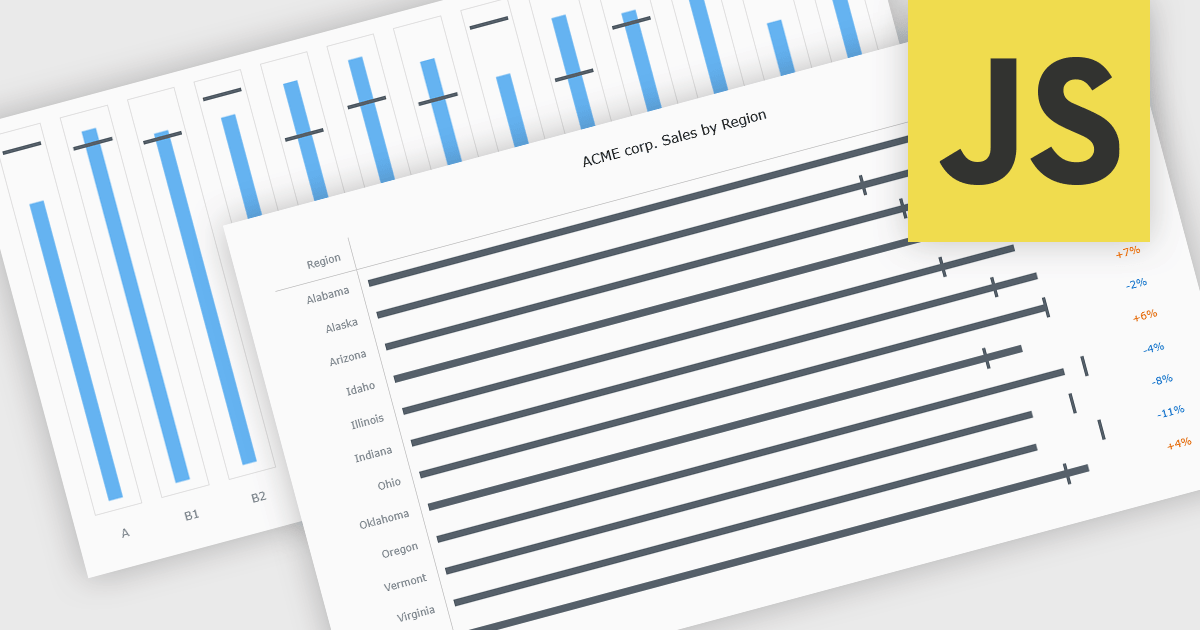
Bullet charts are goal-oriented visualizations that compare actual performance against targets and benchmarks such as budget and forecast values in a single, easy-to-read view. They offer a clear alternative to gauges and meters by showing progress toward goals while making variances and shortfalls immediately obvious. By presenting multiple reference points together, bullet charts help stakeholders interpret performance quickly and consistently across metrics. Common use cases include financial reporting, sales and margin tracking, KPI dashboards, operational scorecards, and executive summaries where fast, reliable comparisons support better decision-making.
Several JavaScript chart controls offer bullet chart support including:
For an in-depth analysis of features and price, visit our JavaScript bullet chart controls comparison.
電話: (888) 850 9911
Fax: +1 770 250 6199


