


公式サプライヤー
公式および認定ディストリビューターとして200社以上の開発元から正規ライセンスを直接ご提供いたします。
当社のすべてのブランドをご覧ください。
英語で読み続ける:
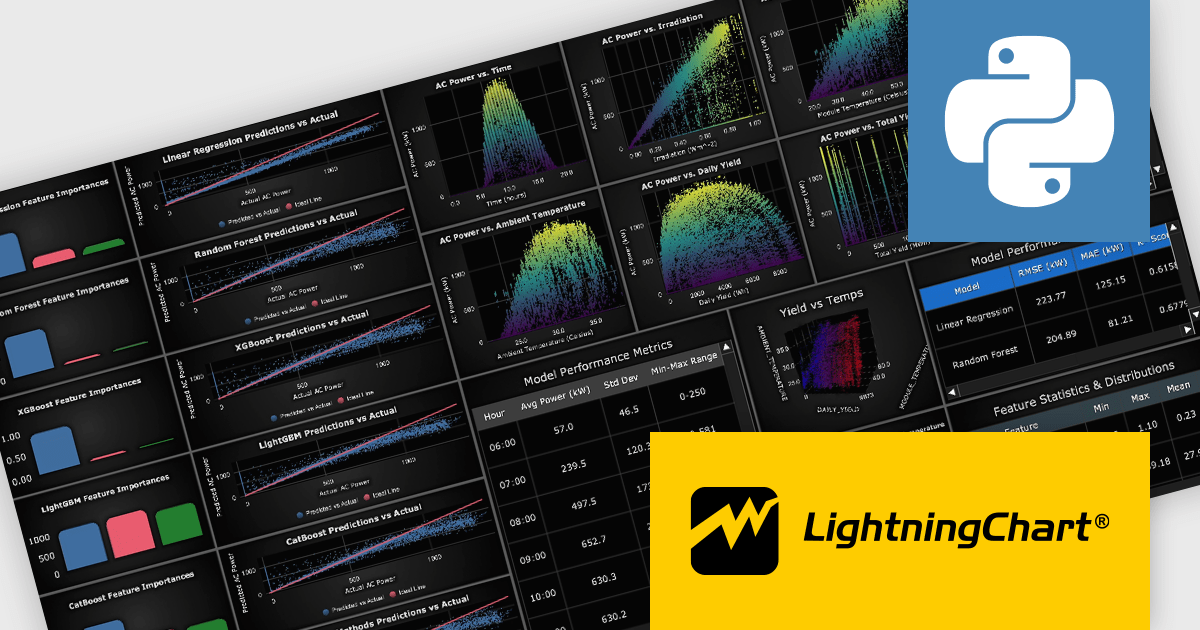
LightningChart Python is a high-performance visualization library designed for real-time analytics and large-scale data rendering. Utilizing GPU acceleration and WebGL, it efficiently processes millions of data points in 2D and 3D with smooth, interactive visuals. Some example chart types include Line graphs, Scatter plots, Heatmaps, Area plots, Box plots, 3D Surface graphs and Mesh plots, and it supports UI elements such as CustomTicks, interval Bands and Constant Lines. It integrates with Python’s data ecosystem, including numpy, pandas, and GUI frameworks like PyQt and PySide, making it a powerful tool for interactive dashboards, financial analytics, scientific simulations, and engineering applications.
The LightningChart Python v2.1 update introduces a new DataGrid component that allows software developers to present metrics, KPIs, and trend information in a single, structured view, combining textual data, numeric values, and compact in-cell charts. By embedding visual context such as sparklines, markers, and thresholds directly within the grid, developers can deliver clearer, more actionable insights without relying on separate chart components. The DataGrid also provides extensive control over styling, enabling consistent integration with existing application designs while reducing the effort required to build and maintain custom data presentation solutions.
To see a full list of what's new in v2.1, see our release notes.
LightningChart Python offers two licensing options: the subscription-based Data Scientist License for internal, non-public facing usage and the perpetual, per-seat Software Developer License for commercial use with professional support and deployment keys. Both licenses allow one active session per user, with developer licenses assigned individually. See our LightningChart Python licensing page for full details.
For more information, see our LightningChart Python product page.
電話: (888) 850 9911
Fax: +1 770 250 6199


