


公式サプライヤー
公式および認定ディストリビューターとして200社以上の開発元から正規ライセンスを直接ご提供いたします。
当社のすべてのブランドをご覧ください。
英語で読み続ける:
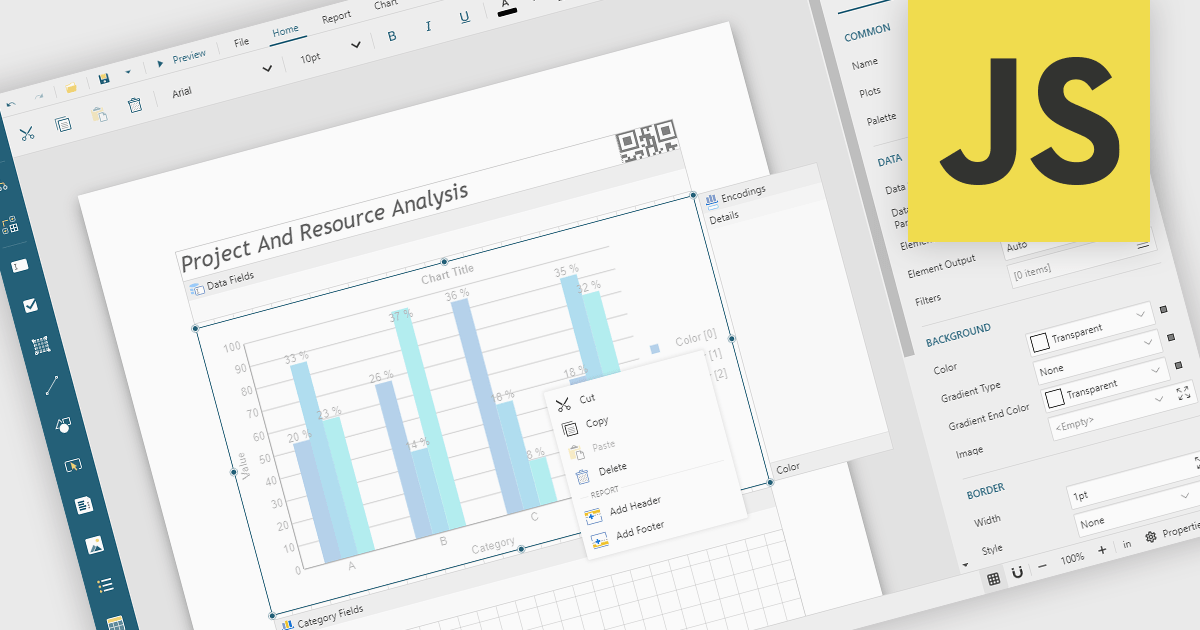
A Visual Report Designer is an application that enables users to create interactive, analytical, and print-ready reports using an intuitive, drag-and-drop interface. It supports fully customizable templates and data visualization components, helping teams present complex information clearly while maintaining consistent branding and layouts. Typical use cases include executive dashboards, financial and operational reports, customer analytics summaries, compliance documents, and branded client-facing reports.
Several JavaScript reporting components offer visual report designers including:
For an in-depth analysis of features and price, visit our JavaScript reporting comparison.
電話: (888) 850 9911
Fax: +1 770 250 6199


