


公式サプライヤー
公式および認定ディストリビューターとして200社以上の開発元から正規ライセンスを直接ご提供いたします。
当社のすべてのブランドをご覧ください。
英語で読み続ける:
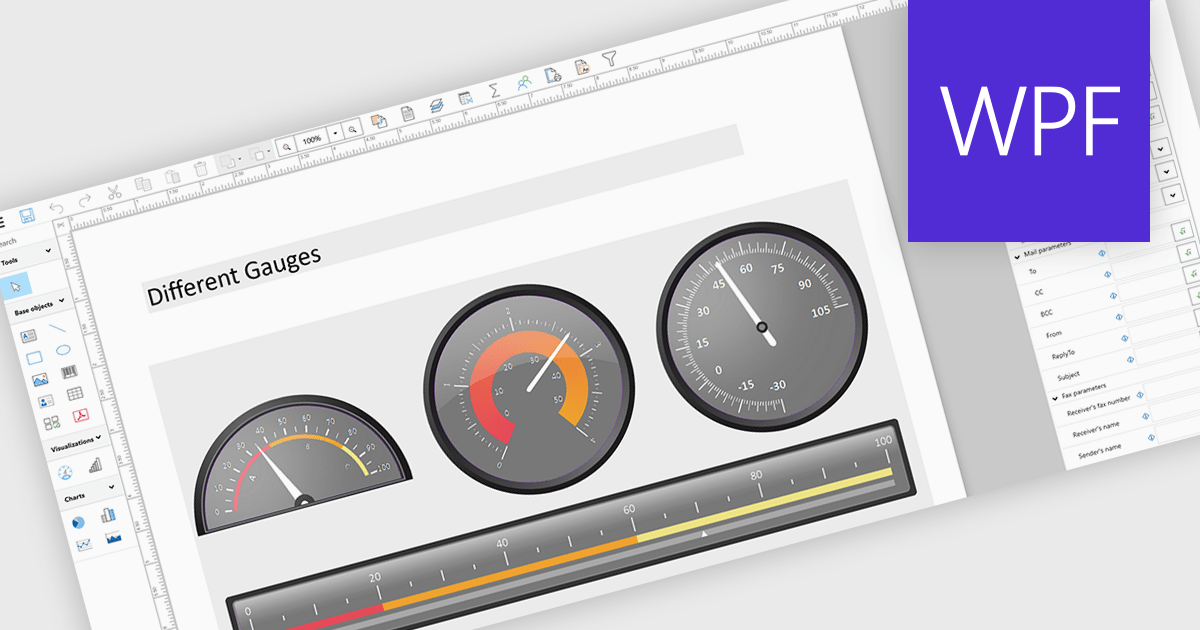
Adding gauges to reports means incorporating visual indicators such as dial or meter style graphics that display key metrics against defined ranges or targets, making performance instantly understandable at a glance. This approach enhances report clarity by transforming complex or dense data into intuitive visuals, helping users quickly assess whether values fall within acceptable, warning, or critical thresholds. As a result, gauges support faster, more informed decision making, improve stakeholder communication, and create more engaging, user friendly reports. Common use cases include tracking sales performance against quotas, monitoring system health or uptime, visualizing budget utilization, and displaying KPI progress in executive dashboards where quick insights are essential.
Several .NET WPF Reporting controls include Gauges including:
For an in-depth analysis of features and price, visit our comparison of .NET WPF Reporting Controls.
電話: (888) 850 9911
Fax: +1 770 250 6199


