


公式サプライヤー
公式および認定ディストリビューターとして200社以上の開発元から正規ライセンスを直接ご提供いたします。
当社のすべてのブランドをご覧ください。
英語で読み続ける:
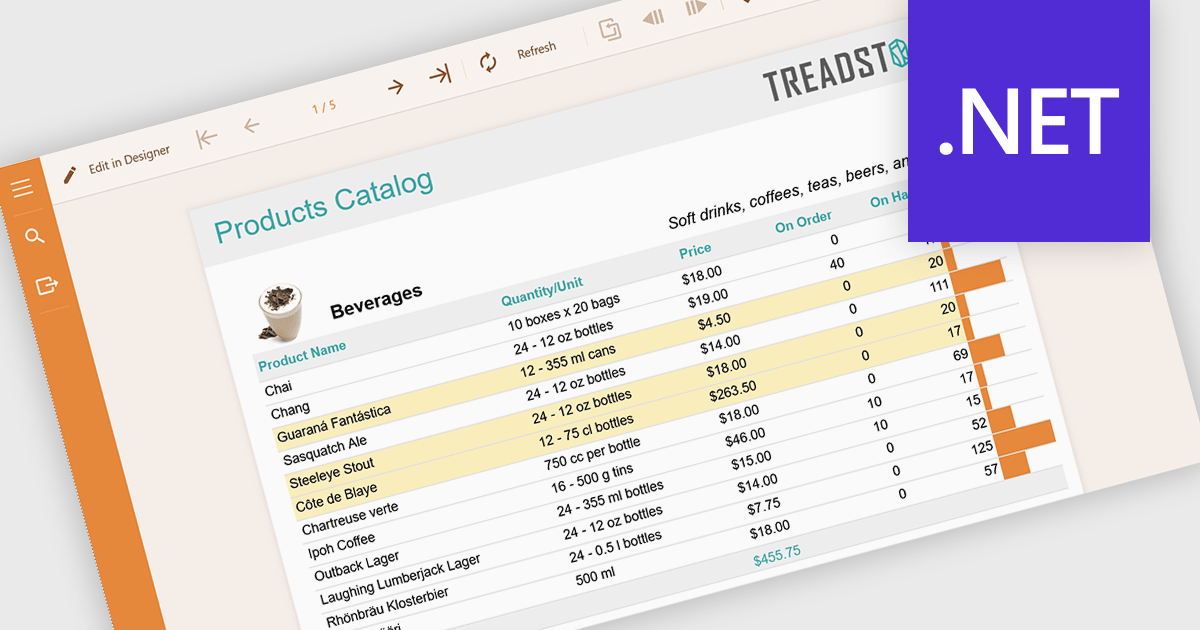
Conditional formatting in reports refers to the automatic application of visual styles such as colours, icons, or data bars based on specific rules or values within the data. This technique enhances reporting by making key information immediately visible, improving readability, and enabling faster, more informed decision making. By dynamically highlighting thresholds, trends, and anomalies, conditional formatting reduces the need for manual analysis while ensuring consistency across reports. Common use cases include flagging underperforming KPIs in financial dashboards, highlighting overdue tasks in project reports, visualising sales performance against targets, and identifying outliers in large datasets. Overall, it transforms static data into intuitive, actionable insights that are easier for users to interpret at a glance.
Several .NET reporting components allow you to apply conditional formatting, including:
For an in-depth analysis of features and price, visit our comparison of .NET reporting components.
電話: (888) 850 9911
Fax: +1 770 250 6199


