


公式サプライヤー
公式および認定ディストリビューターとして200社以上の開発元から正規ライセンスを直接ご提供いたします。
当社のすべてのブランドをご覧ください。
英語で読み続ける:
Highcharts is a JavaScript charting framework that allows web developers and data analysts to generate dynamic, visually appealing charts and graphs for websites and web applications. It can display a variety of chart types, including line, spline, area, column, bar, pie, scatter, and many more. Highcharts is well-known for its ease of use, rich documentation, and ability to handle huge datasets efficiently. Features include responsive design, accessibility support, and cross-browser compatibility. Its customization capabilities allow users to create bespoke data visualizations that increase engagement and provide insightful data presentations.
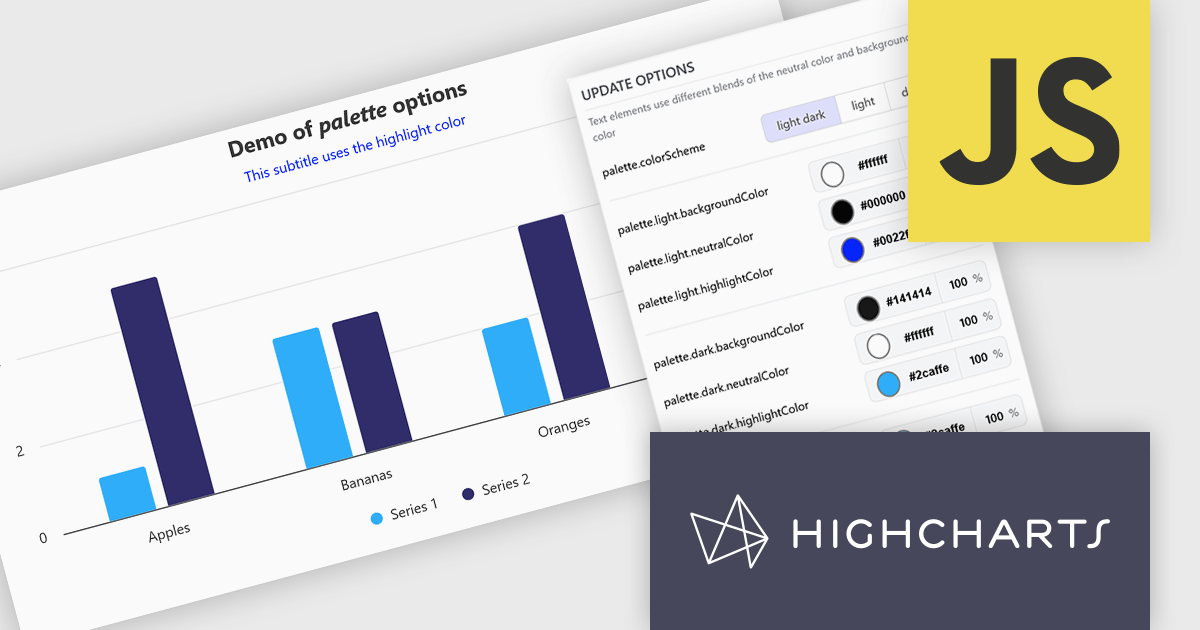
The Highcharts v13 update introduces a centralized color palette system that enables developers to define and manage chart colors, light and dark mode variations, and UI styling from a single configuration. By consolidating color settings across series, chart elements, and interactive states, it reduces repetitive configuration, simplifies brand consistency, and makes large chart collections easier to maintain. The addition of color scheme support and CSS variable exposure also allows charts to adapt more seamlessly to application themes and user preferences while providing greater flexibility for custom styling.
To see a full list of what's new in v13, see our release notes.
Highcharts Core is licensed on an annual or perpetual basis, OEM licenses, and Advantage Renewals. It is licensed per Developer and has several license options including Internal, SaaS, and Self Hosted. See our Highcharts Core licensing page for full details.
Learn more on our Highcharts Core product page.
電話: (888) 850 9911
Fax: +1 770 250 6199


