


公式サプライヤー
公式および認定ディストリビューターとして200社以上の開発元から正規ライセンスを直接ご提供いたします。
当社のすべてのブランドをご覧ください。
英語で読み続ける:
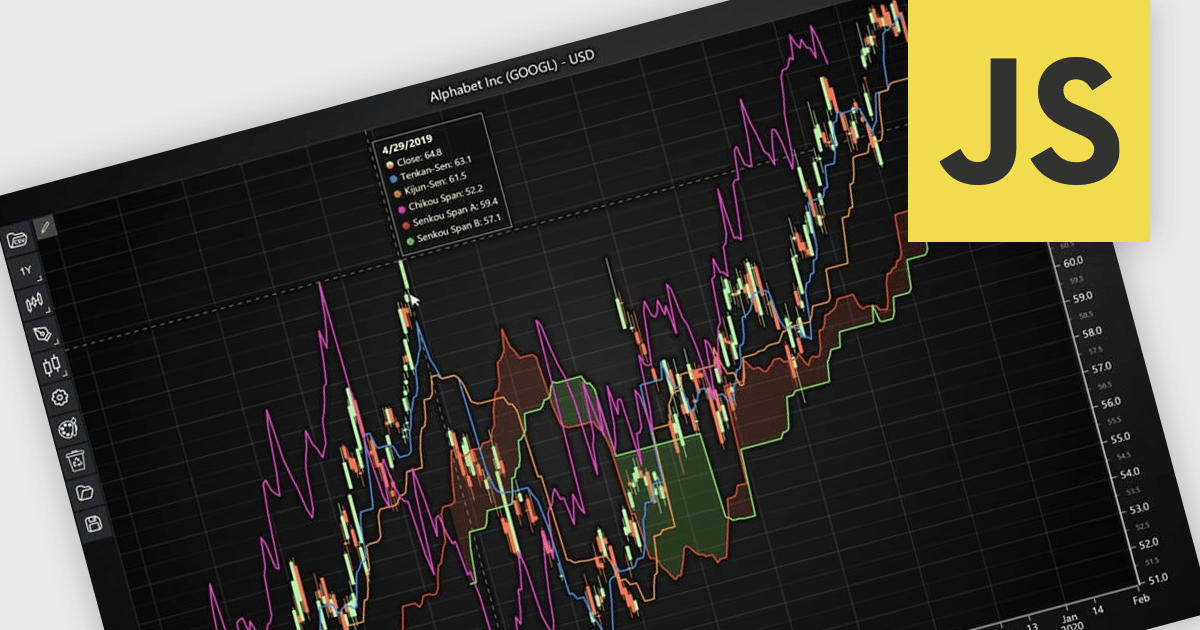
Chart indicators are tools that display calculated data on a chart to help users identify trends, measure momentum, recognize support and resistance levels, and spot potential reversals. By presenting complex market data as clear visual signals, they simplify analysis, support faster decision making, and help users uncover opportunities. Common use cases include tracking trend strength, confirming entry and exit points, and identifying key price levels where market direction may change.
Several JavaScript charting components provide support for indicators within financial charts, including:
For an in-depth analysis of features and price, visit our JavaScript chart components comparison.
電話: (888) 850 9911
Fax: +1 770 250 6199


