ピボットチャートで複雑なデータを視覚化
インタラクティブなピボットチャートを作成して、集計データを視覚化し、トレンドを発見し、効果的なデータ分析をサポートします。
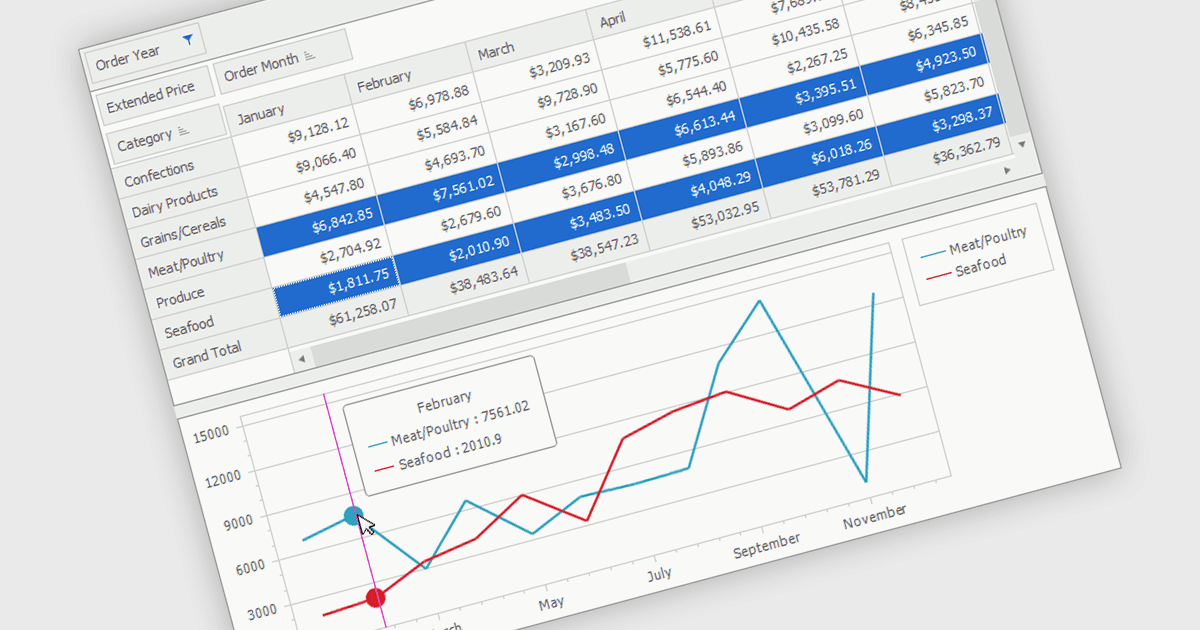
ピボットチャートは、ピボットテーブルと連携して集計データをグラフィカルに表示するインタラクティブなデータ可視化ツールです。ユーザーはカテゴリ、シリーズ、フィルターを動的に変更してデータセットを分析でき、元のデータを変更する必要はありません。トレンドや比較、パターンを視覚的に提示することで、複雑な情報を理解しやすくし、迅速な意思決定を支援します。ビジネスインテリジェンス、レポーティング、データ分析で広く使われており、集計データの柔軟な探索が重要なシーンに適しています。
いくつかの .NET WinForms UIスイートでは、ピボットチャート機能を提供しています。例として:
- DevExpress WinForms は、Pivot Gridの集計を視覚化し、トレンドを明らかにし、多次元データ分析を簡素化するインタラクティブなピボットチャートの作成を可能にします。
- MESCIUSのComponentOne Studio WinForms は、集計データからピボットチャートを作成して、トレンド分析およびレポートの明確化を支援します。
- Syncfusion Essential Studio UI Component Suite は、Pivot Tableの集計を視覚的な洞察に変換するインタラクティブなピボットチャートを提供し、効率的なビジネス分析を促進します。
機能や価格の詳細な分析については、.NET WinForms UIスイートの比較をご覧ください。