
MindFusion.Charting for .NET Blazor(英語版)
Blazor.NET Webアプリケーションであらゆる種類のグラフとダッシュボードをレンダリングおよびスタイル設定
MindFusion Group 社の製品
2003 年より日本国内にてComponentSourceで販売中。
価格:¥ 62,260 (税込)〜 バージョン: 1.0.4 更新日: Jan 4, 2025
Blazor.NET Webアプリケーションであらゆる種類のグラフとダッシュボードをレンダリングおよびスタイル設定
MindFusion Group 社の製品
2003 年より日本国内にてComponentSourceで販売中。
価格:¥ 62,260 (税込)〜 バージョン: 1.0.4 更新日: Jan 4, 2025
 のスクリーンショット")
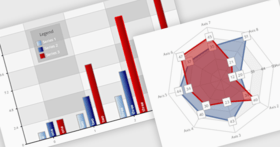
MindFusion.Charting for Blazor is a powerful tool designed to help developers easily integrate a wide range of interactive and customizable charts and dashboards into Blazor.NET applications. With extensive support for various chart types, from bar and line charts to more advanced visualizations, it enables users to create data-driven web applications with minimal effort. The library also offers flexible styling options, intuitive APIs, and seamless rendering capabilities, making it an ideal choice for building visually appealing and dynamic charting solutions in Blazor projects.


画像1 / 5
MindFusion.Charting for Blazor Features
電話: (888) 850 9911
Fax: +1 770 250 6199


