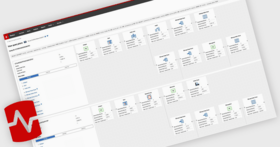
Custom Metrics for PostgreSQL
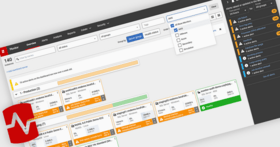
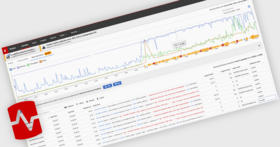
Top Waits in a PostgreSQL InstanceYou can filter the Top Waits view by time range and, where needed, narrow it to a specific database. Clicking into individual wait types and events then surfaces the related query data, making it easier to see which queries were associated with those waits and investigate what was driving the slowdown.
Index Page Example
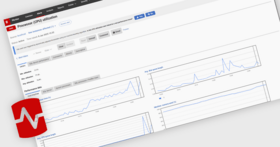
Database-level Insights
Postgres MonitoringRedgate Monitor offers PostgreSQL users faster ways to investigate performance problems, with new capabilities such as Query Compare, Top Waits, database-level insights, and custom metrics.
Disk Usage
Alerts
Configuration Compliance
Security Permissions
Example Report
Continuous delivery without performance riskRedgate Monitor helps you accelerate database deployments with confidence – without risking performance, stability, or compliance.
Speed up the auditing processEnsure you can provide audit information at any time.
Prevent unauthorized access to dataGet a history of permissions across your entire server estate.
Maintain high standards of security and regulatory complianceEnsure SQL Server configurations are always audit-ready and aligned with the latest compliance standards.
Align with Azure best practicesGet the visibility and control needed to meet best practices for cost optimization, performance efficiency, operational excellence, reliability, and security.
Monitoring Databases on AzureFrom planning your migration to optimizing workloads, modernizing your data platform, and managing a multi-platform environment, Redgate Monitor gives you the database observability you need to stay in control.
Modernize without losing controlEasily adopt AWS’s modern database services without having to worry about disruptions or monitoring overhead: Redgate Monitor gives you database observability across hybrid and cloud-native environments all from one central dashboard.
Optimize Cloud WorkloadsAvoid unexpected costs and performance slowdowns by understanding exactly what’s driving resource usage.
Ensure a smooth and risk-free migration to AWSSimplify migration to AWS with full visibility into database performance before, during, and after. Understand baselines and detect issues early to avoid downtime.
Right-size your cloud environmentLeverage insights such as workload characteristics and performance baselines to select the right cloud offering and right-size your environment.
Avoid unnecessary hosting costs by making an informed decision on the required CPU, memory, disk space, and more. Redgate Monitor helps you understand your bottle necks and where strategic tuning efforts will best help you achieve good performance.
Ensure vacuum maintenance is running smoothlyImproper vacuum maintenance is a risk to your PostgreSQL database performance and can even lead to catastrophic forced shutdown in extreme situations. With Redgate Monitor you’re able to spot signs of unhealthy vacuum performance and reveal areas of configuration improvements.
Avoid Resource BottlenecksBottlenecks aren’t always obvious. Redgate Monitor helps you make informed decisions.
Effectively manage resource bottlenecks with intuitive graphical representations of how connections, memory, and server load interact. Get baseline data for context of whether your connection load is typical during a pre-defined time frame.
Avoid memory constraint issues using the Cache Hit Ratio visualization graph. Observe when Cache Hit Ratio is unusually low or has consistent dips that correlate with high usage and poor performance.
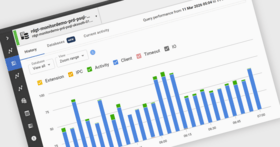
Identify problematic or slow queriesRedgate Monitor automatically tracks query performance statistics so you can quickly and easily identify issues and get actionable insights on the root causes.
Monitor what matters in the cloudCollect and monitor metrics that are specific to your cloud provider. Monitor metrics such as DTUs or vCore quota in Azure SQL Database so you’re able to optimize your cloud service tiers and ensure adequate up-time.
Consistent Monitoring Across all PlatformsMonitor on-prem and cloud platforms consistently with Redgate Monitor. From Azure SQL to Amazon RDS and beyond, keep visibility and control.
Ensure the availability, security and performance of databases hosted across a range of different platforms by monitoring them from a central, single pane of glass with a consistent approach and minimum effort.
Cloud Database MonitoringConfidently migrate, optimize, and modernize your databases in the cloud. Redgate Monitor provides context-rich diagnostic insights and performance baselines for a healthy and cost-efficient cloud environment.
Monitor AI for Query AnalysisMonitor AI detects bottlenecks, analyzes execution trends, and surfaces actionable fixes – without the manual grind. Get faster insights and proactively optimize performance, so your databases stay reliable, and your team stays ahead. Gain deep visibility into query behavior, execution patterns, and wait times, paired with intelligent recommendations to resolve issues quickly.
Scale with expanding server estatesRedgate Monitor grows and adapts with your server estate, offering the scalability to support your complex, multi-platform environment. Regardless of where your servers are hosted, consistent monitoring for on-prem and cloud databases means you can manage your entire environment from a single pane of glass – giving you the agility to respond quickly as things change. Stay on top of configurations, access rights, installed versions and patches, licensing, disk usage statistics, backups and more – all in one place.
Minimize downtimeWhether your databases are hosted on-premises, in the cloud or a mixture of both, with instant problem diagnosis and customizable alerts you have the answers to the health of your estate at your fingertips. Drill down into potential issues and solve them before they become a problem.
Increase efficiency and performanceRedgate Monitor accelerates daily database maintenance by automating time-consuming tasks, such as identifying long-running queries or tracking blocked processes. Now equipped with Monitor AI, you can instantly surface performance bottlenecks and tune queries faster – without the manual effort. This frees up time to proactively improve the performance and security of your servers while ensuring your monitoring solution evolves as your challenges do.
Monitor your entire server estate from a single pane of glassRedgate Monitor helps you manage your entire database estate from a single pane. Monitor SQL Server, PostgreSQL, Oracle, MySQL, and MongoDB – on premises, in the cloud, or in hybrid environments. Get database observability to proactively mitigate potential risks with instant problem diagnosis and customizable alerting.

 のスクリーンショット")