
List & Label Enterprise Reporting Edition(英語版)
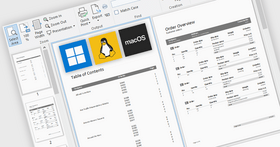
Windows、macOS、Linux、Android向けのクロスプラットフォームレポートソリューション
combit 社の製品
2010 年より日本国内にてComponentSourceで販売中。
価格:¥ 470,800 (税込)〜 バージョン: 31.002 新機能 更新日: May 19, 2026 ![]()
![]()
![]()
![]()
![]() (4)
(4)
Windows、macOS、Linux、Android向けのクロスプラットフォームレポートソリューション
combit 社の製品
2010 年より日本国内にてComponentSourceで販売中。
価格:¥ 470,800 (税込)〜 バージョン: 31.002 新機能 更新日: May 19, 2026 ![]()
![]()
![]()
![]()
![]() (4)
(4)
 のスクリーンショット")
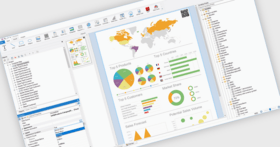
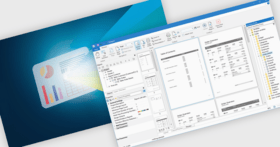
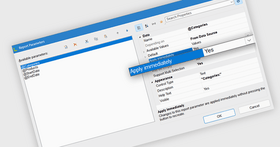
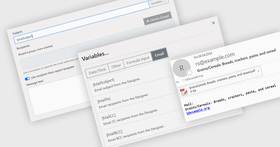
List & Label は、あらゆるタイプの計算を含みただ少数のコード行だけを加えるで、アプリケーションを拡張することを容易にします:レポート、 サブレポート、単純リスト、マルチテーブル、 クロスタブ、チャート、フォーム、ラベル、印刷、プレビュー、エクスポートと Web レポーティング。List & Label Report Designer はスタンダード、プロフェッショナルとエンタープライスエディションに含まれ、パワフルな機能で、速く容易にアプリケーションを強化します。追加の使用料金なしで、たいていのデスクトップアプリケーションにパスすることができます。プロフェッショナルとエンタープライスエディションは機能アップグレードとメジャーバージョンへのアップグレード、電話とEメールによる1年間のサポートにサービスパックなどを提供する、サブスクリプションを含みます。エンタープライスエディションはサーバ / Web サーバアプリケーションのためのランタイムライセンスの利用が可能な List & Label Language Kits fir Designer を含みます。


画像1 / 18
Klaus Mueller, Lear Corporation, Germany
電話: (888) 850 9911
Fax: +1 770 250 6199


