Animation in charts can be used to improve the readability, comprehension and engagement of data visualizations. By incorporating animation in charts you can draw attention to specific points and trends, helping your audience better understand the information being conveyed.
Several WinForms charting components offer animation support, including:
- TeeChart WinForms provides animation capabilities, allowing developers to create visually captivating charts with smooth transitions and effects.
- .net Charting offers animation support, enabling WinForms developers to add engaging, interactive charts to their applications.
Alternatively, there are several suites which contain charting components that support chart animation:
- DevExpress WinForms Chart (part of DevExpress WinForms) provides a comprehensive charting solution with built-in animation support, allowing for smooth transitions and effects during data updates and interactions.
- Telerik Windows Forms ChartView (part of Telerik UI for WinForms) offers animation capabilities, enabling developers to create engaging and interactive charts with seamless transitions.
- Syncfusion WinForms Chart (part of Syncfusion Essential Studio for WinForms) includes animation support, allowing developers to create visually appealing charts with fluid animations.
- Infragistics Windows Forms Charts (part of Infragistics Ultimate UI for WinForms) offers a powerful charting toolkit with animation features, providing developers with the ability to create dynamic and captivating visualizations.
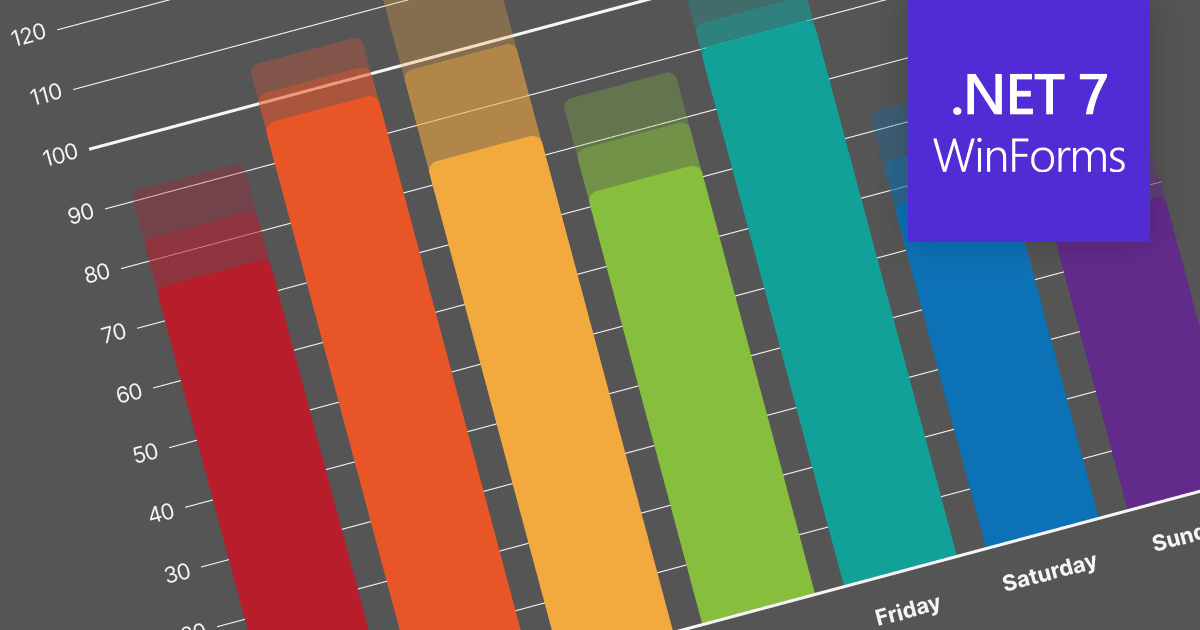
For an in-depth analysis of features and price, visit our comparison of .NET 7 WinForms charts.
Compare .NET 7 WinForms Charts