


公式サプライヤー
公式および認定ディストリビューターとして200社以上の開発元から正規ライセンスを直接ご提供いたします。
当社のすべてのブランドをご覧ください。
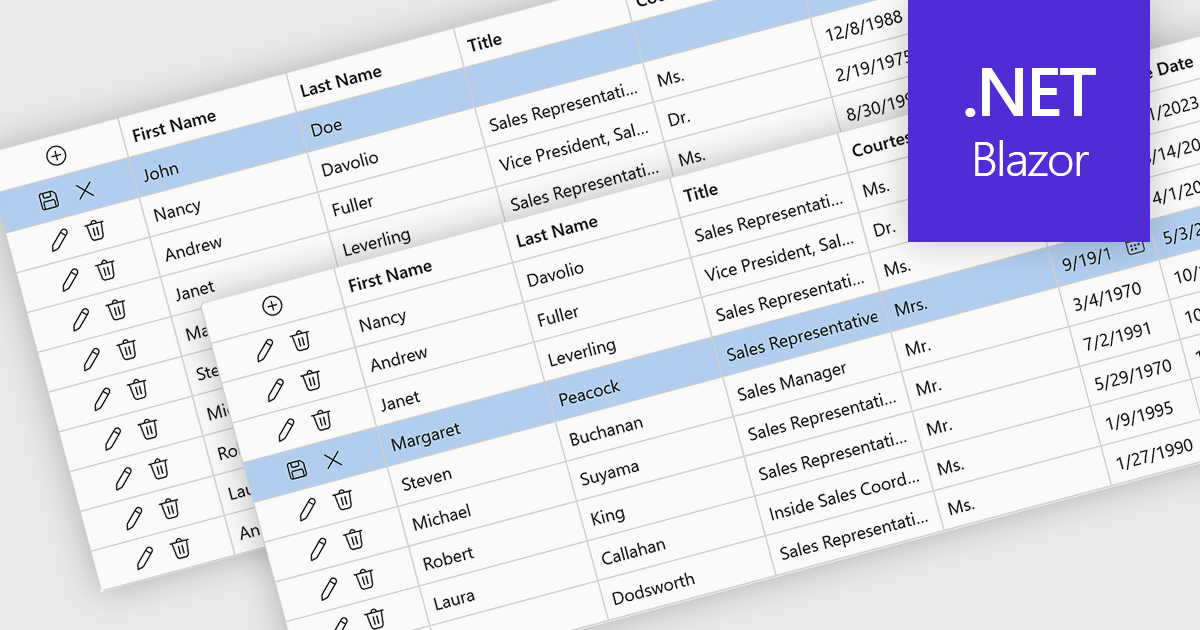
Row editing in grids allows users to update an entire record directly within a data grid, editing multiple fields at once without opening a separate form. This improves productivity by reducing clicks, keeping users in context, and making data updates faster and more intuitive. It also helps improve accuracy by allowing related information to be reviewed and validated together. Common use cases include managing customer records, updating inventory, processing orders, and maintaining employee or financial data in business applications.
Several .NET Blazor components provide data grids that allow row editing, including:
For an in-depth analysis of features and price, visit our comparison of .NET Blazor grid components.
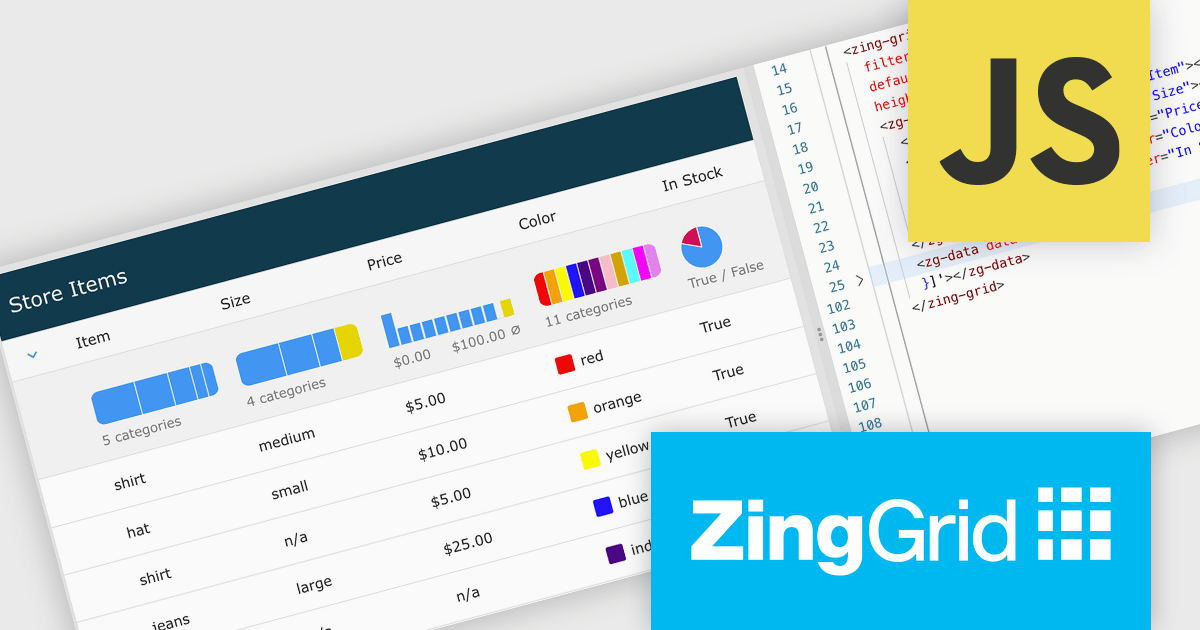
ZingGrid is a JavaScript library that simplifies the creation of interactive data tables and grids within web applications. Utilizing modern web components and focusing on performance and responsiveness, ZingGrid allows developers to implement features like searching, filtering, pagination, and in-line editing with minimal coding. This empowers efficient data visualization and manipulation for users, making it a valuable tool for web development.
The ZingGrid 2.2.0 update introduces a Filter Summary Chart that enables users to visually explore and filter data through an interactive chart interface, making it easier to identify patterns, trends, and distributions within large datasets. By combining data visualization with filtering functionality, the feature helps users refine results more intuitively and efficiently than traditional filter controls, while allowing developers to quickly add this capability at either the grid or column level with minimal configuration.
To see a full list of what's new in version 2.2.0, see our release notes.
ZingGrid is available as either a Single-Domain Website or Multi-Domain SaaS license. See our ZingGrid licensing page for full details.
For more information, visit our ZingGrid product page.
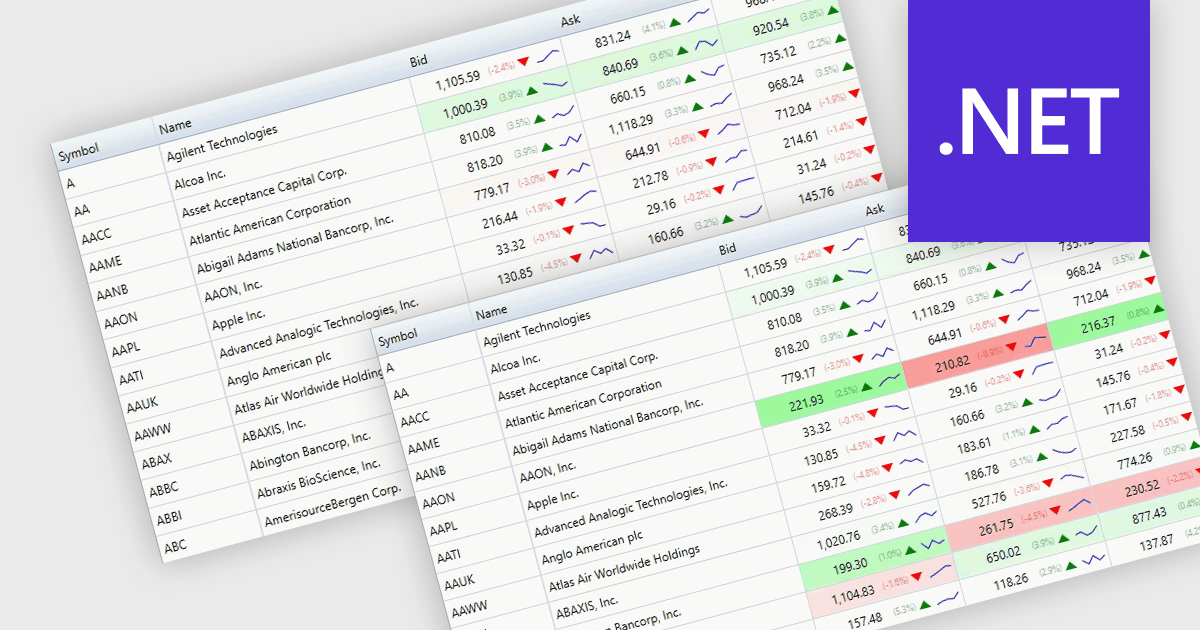
Dynamic updates, also known as live data rendering, enable a data grid to automatically refresh displayed information when the underlying data source changes, without requiring manual intervention, a full-page reload, or a complete grid refresh. This helps users work with current data while maintaining their position and context within the grid. Depending on the implementation, dynamic updates can refresh only affected records or cells, reducing unnecessary rendering, improving responsiveness, and limiting avoidable data transfer. This capability is especially valuable in applications where timely visibility of changing information is important, such as financial dashboards, operational monitoring systems, and inventory management solutions.
Several .NET components provide data grids that allow dynamic updates, including:
For an in-depth analysis of features and price, visit our comparison of .NET grid components.
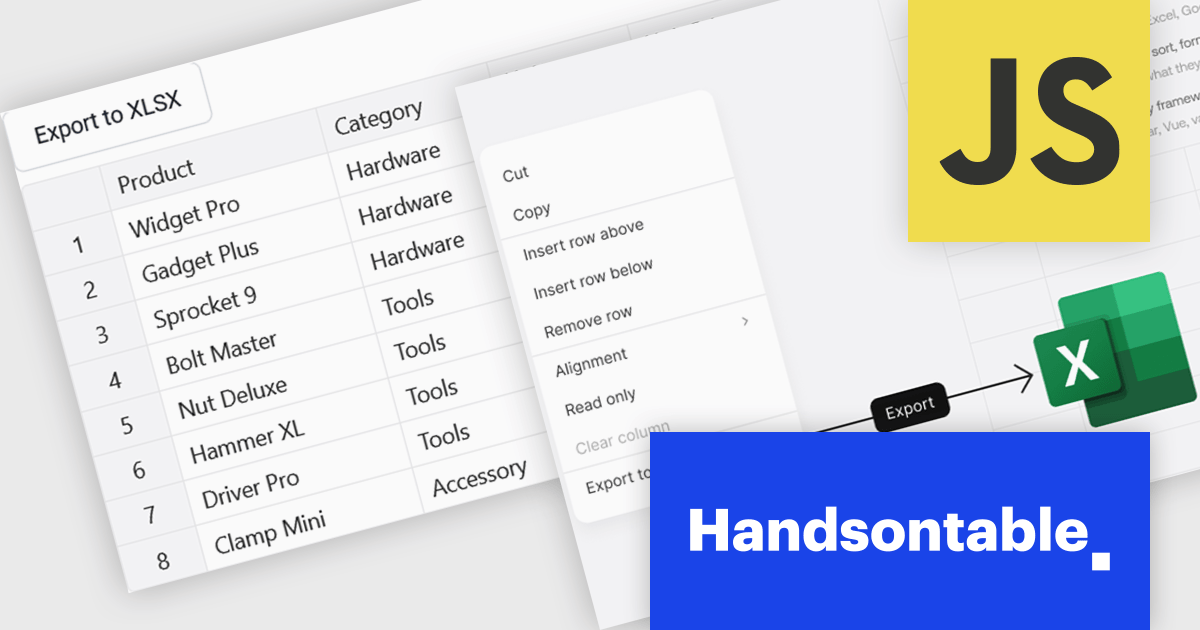
Handsontable is a JavaScript library designed to help developers build interactive data grids into their web applications. Offering a familiar spreadsheet-like interface, it allows users to edit, sort, and filter data with ease. Highly customizable and compatible with popular frameworks like React and Angular, Handsontable empowers developers to build robust data manipulation features into their web applications.
The Handsontable 17.1.0 update includes native export to Excel support, allowing users to save rendered grid data directly to XLSX format. The export reflects the current view of the table, including column order, visible columns, applied filters, sort order, frozen rows and columns, and merged cells. Cell types such as numbers, dates and checkboxes are mapped to their Excel equivalents where possible, helping exported files open cleanly in Microsoft Excel, Google Sheets and Apple Numbers without additional formatting or data preparation. This makes it easier to share and analyze data while maintaining the structure and context users see within the grid.
To see a full list of what's new in version 17.1.0, see our release notes.
Handsontable is licensed per developer and is available as an Annual or Perpetual license with 1 year support and maintenance. See our Handsontable licensing page for full details.
For more information, visit our Handsontable product page.
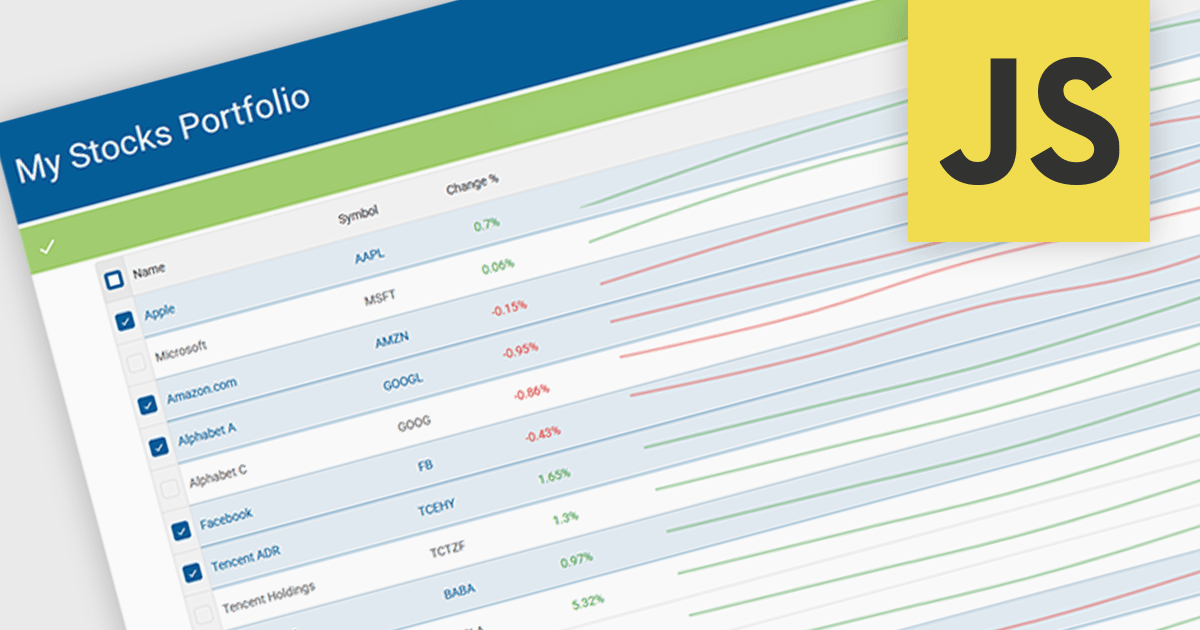
Sparklines in grids display compact visual charts directly inside grid cells, making it easier to identify trends, patterns, and performance without leaving the table view. By transforming raw data into clear visual insights, they help users analyze information faster, reduce dashboard clutter, and make more informed decisions. Common use cases include tracking stock performance in financial applications, monitoring sales and revenue trends in business dashboards, and highlighting operational KPIs in enterprise reporting systems.
Several JavaScript grid controls offer support for sparklines including:
For an in-depth analysis of features and price, visit our JavaScript Grid controls comparison.
電話: (888) 850 9911
Fax: +1 770 250 6199


