


公式サプライヤー
公式および認定ディストリビューターとして200社以上の開発元から正規ライセンスを直接ご提供いたします。
当社のすべてのブランドをご覧ください。
ActiveReportsJS is a powerful, lightweight reporting tool designed to integrate advanced reporting capabilities into any JavaScript application. ActiveReportsJS enables developers to create, view, export, and print richly formatted reports entirely on the client side - with zero server dependencies.
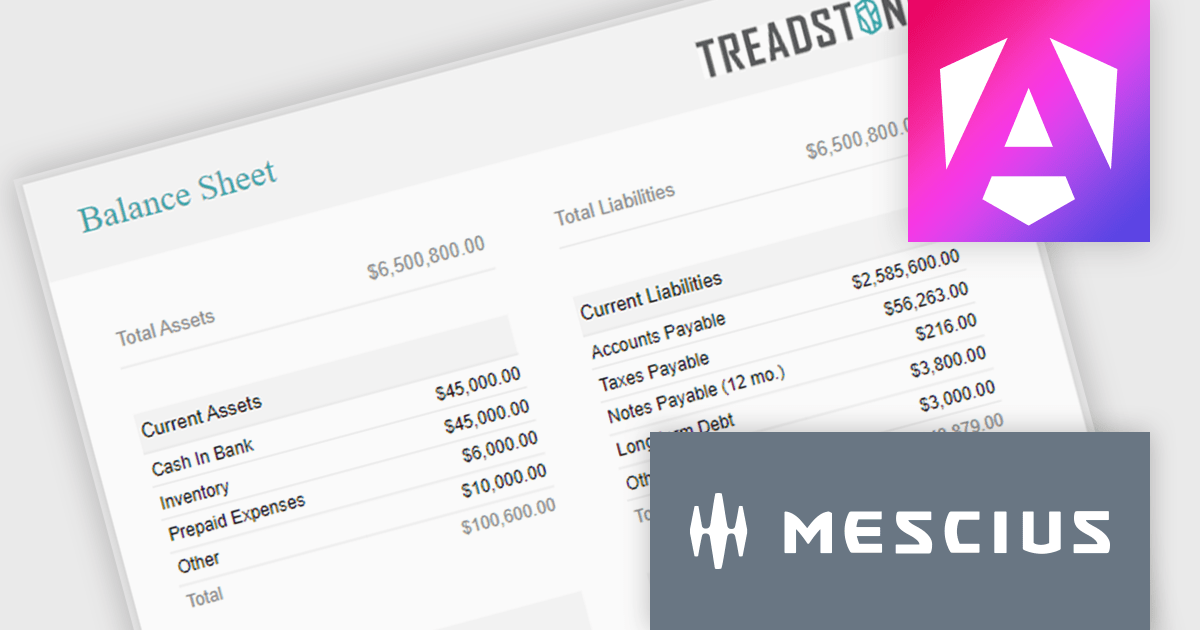
Balance sheets provide a snapshot of an organization's financial position at a specific point in time. By summarizing assets, liabilities, and equity, these reports help creditors, investors, and stakeholders evaluate a company's financial health. In this blog post, MESCIUS Product Manager Joel Parks demonstrates how to use the Angular Report Designer to give users the ability to design, view, and interact with reports directly from within your web application. Steps include:
Read the complete blog to get started creating polished, interactive balance sheets within your web applications.
ActiveReportsJS is licensed on an annual subscription or perpetual basis and is available as a Single Deployment License for non-commercial use, and as a Single Domain License or Unlimited Domain License for commercial and/or SaaS use. See our ActiveReportsJS licensing page for full details.
For more information, visit our ActiveReportsJS product page.
ActiveReports for .NETは、Visual Studio上で帳票アプリケーションを開発できる.NET開発コンポーネントです。Windowsフォーム、WPF、ASP.NET、ASP.NET Core、Blazorの5つのプラットフォームをサポートし、レイアウトや書式といった外観デザインの設定から、データ接続、印刷およびPDFへの出力設定まで、帳票開発に必要なあらゆる機能を備えています。
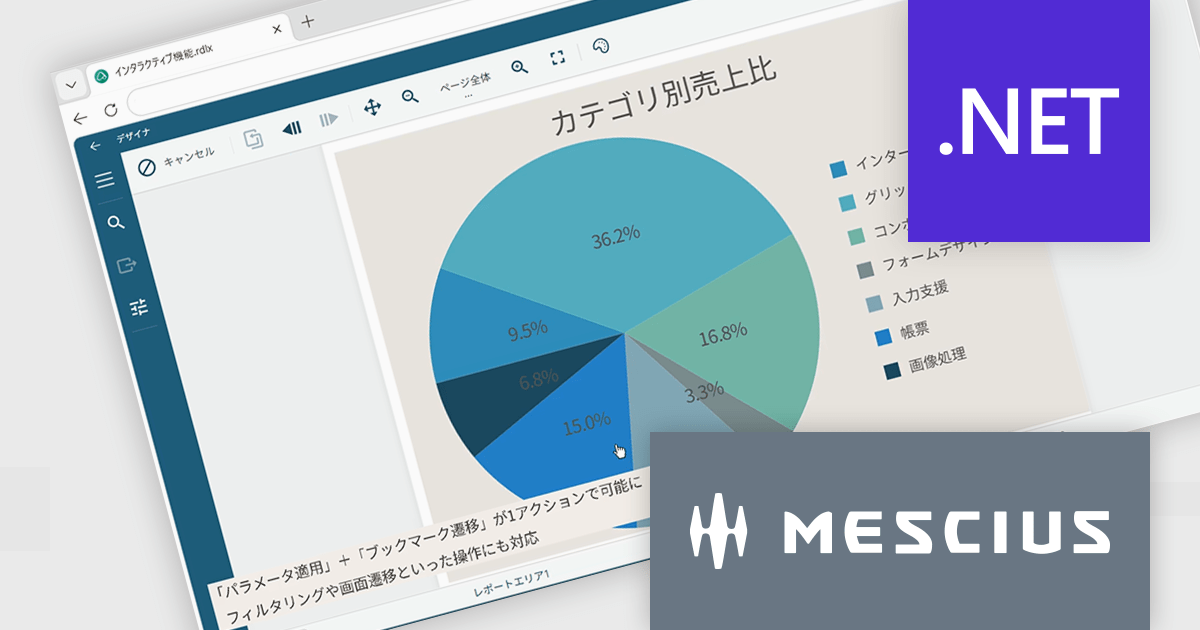
ActiveReports for .NET 20.0J SP1では、ページレポート、RDLレポート、ダッシュボードで利用できるAIレポートウィザードが強化されました。従来の対応モデルに加え、新たにGoogle GeminiとOllamaを利用できるようになり、クラウド型AIだけでなく、ローカル環境で動作する言語モデルも選択可能になりました。これにより、セキュリティ要件や社内ポリシーに合わせた柔軟な運用が可能です。
また、AIが生成するレイアウトの精度も向上しました。日付フィールドの書式設定、テーブル列構成の最適化、グループヘッダやフッタ、改ページ設定の改善により、生成後の調整作業を軽減できます。データセットからテーブルやチャートの構成案を効率よく作成できるため、帳票開発の初期設計をスムーズに進められます。
20.0J SP1での新機能一覧は、リリースノートを参考ください。
本製品のライセンスは、開発者ごとに付与されるユーザーライセンスで、対象開発者は最大3台のマシンにインストール可能です。本製品の機能を組み込んで開発したクライアントサイドアプリケーションはランタイムライセンスは不要です。ただし、サーバーサイドアプリケーションを運用環境へ配布の際には”コアサーバーライセンス”が必要です。なお、年間保守サービスが付属しており、無償バージョンアップや日本語によるE-mail技術サポートを無制限に受けることができます。詳細は、ActiveReports for .NETのライセンスページをご参照ください。
ActiveReports for .NETの製品詳細及び販売情報は、下記の各エディション別の専用ページをご参考ください。
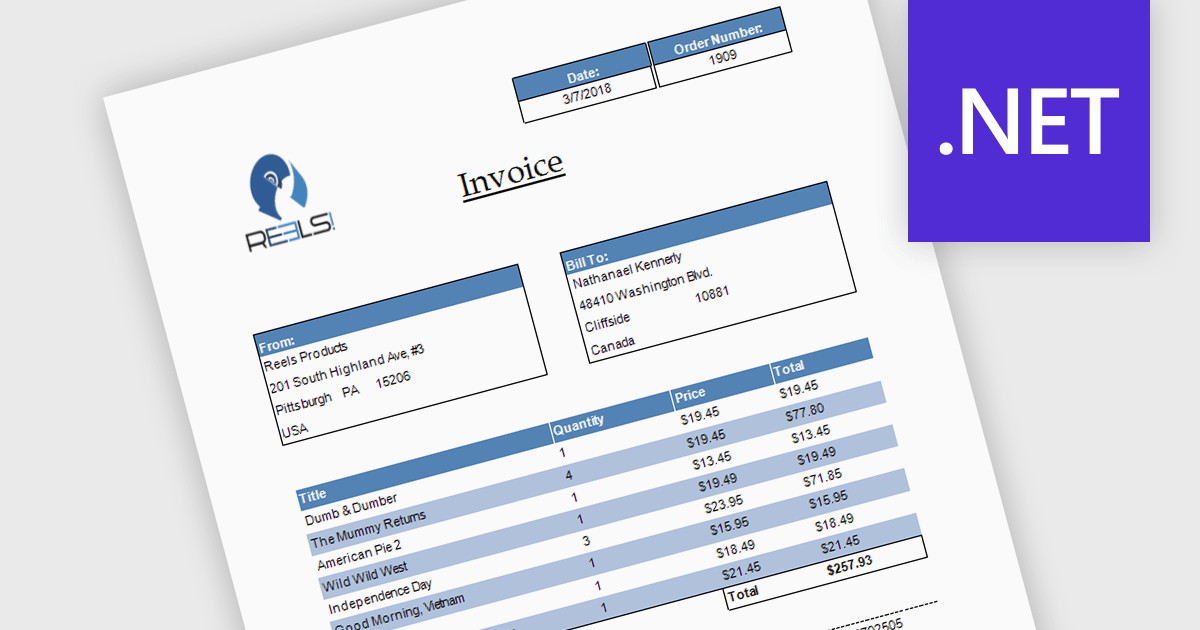
Subreports allow you to embed one report within another, making it easy to display related or detailed information alongside primary report data. By organizing complex reports into reusable sections, subreports improve clarity, simplify maintenance, and reduce development effort. They also support hierarchical data and multiple data sources, making them ideal for invoices with line items, customer reports with purchase histories, and sales reports with detailed transaction data.
Several .NET reporting controls offer support for subreports including:
For an in-depth analysis of features and price, visit our .NET reporting controls comparison.
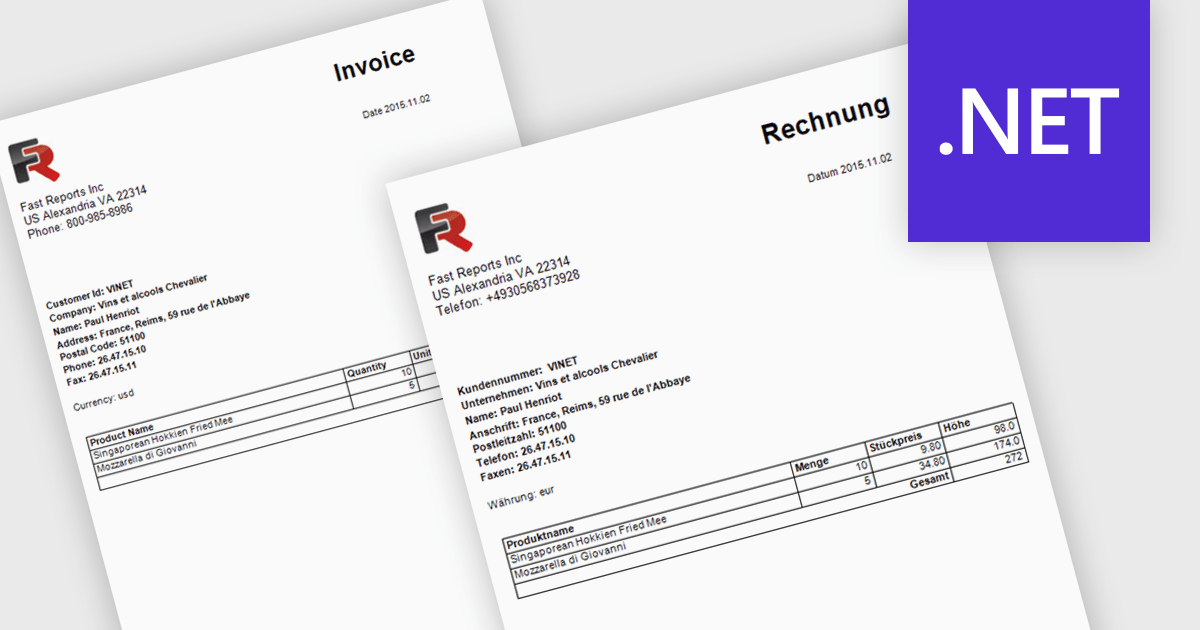
Report localization is the process of translating and adapting reports into different languages so organizations can share data and insights with global audiences. By presenting reports in a user's preferred language, organizations can improve accessibility, increase understanding, and reduce the risk of misinterpreting important information. This helps teams, customers, and stakeholders make more informed decisions while maintaining a consistent reporting experience across regions. Common use cases include localized sales reports for regional teams, analytics dashboards for international customers, and financial or compliance reports that need to be available in multiple languages.
Several .NET reporting controls offer localization including:
For an in-depth analysis of features and price, visit our .NET reporting controls comparison.
DevExpress Universal is a comprehensive suite of UI components and developer tools that supports the creation of feature-rich applications across web, desktop, and mobile platforms, including .NET, JavaScript, Blazor, ASP.NET, WinForms, WPF, and MAUI. It focuses on delivering consistent user interfaces, advanced data visualization, reporting, dashboards, and productivity features that help teams design, build, and maintain complex applications using a unified set of technologies and patterns.
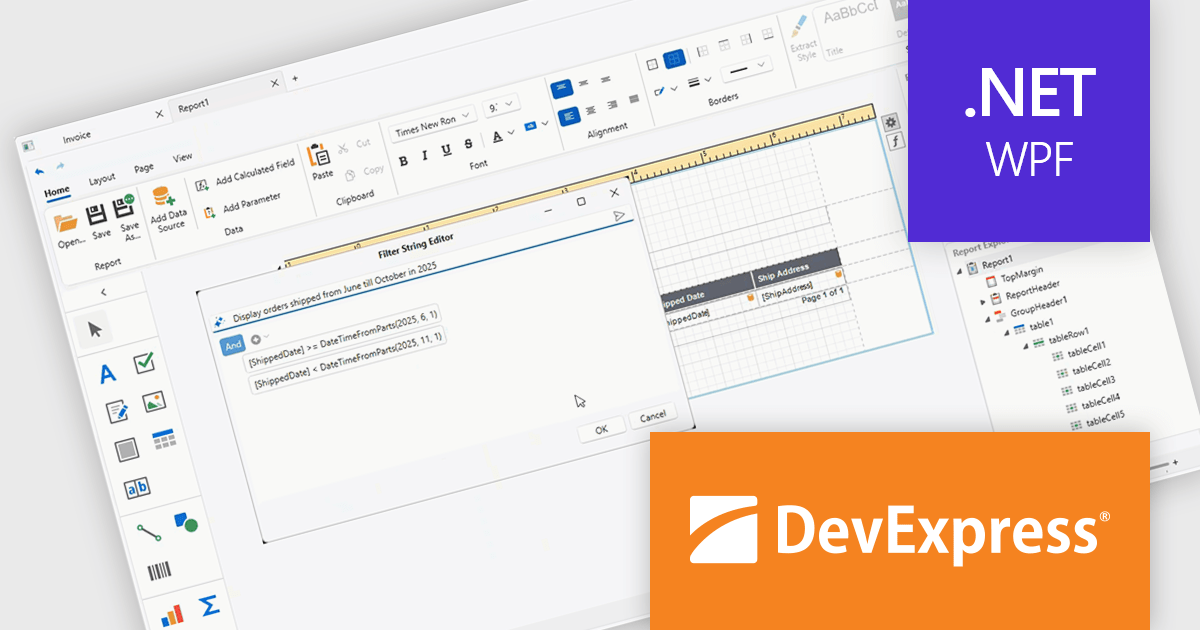
DevExpress Universal 26.1 improves the WPF Report Designer with AI-assisted expression generation within both the Expression Editor and Filter String Editor. Instead of manually writing complex Criteria Language expressions, users can simply describe the required business logic in natural language and have the expression generated automatically. This capability helps reduce the learning curve for advanced reporting features, accelerates report creation, and makes it easier for developers and business users alike to build filters, calculated fields, and other expression-based functionality with greater confidence and accuracy.
DevExpress Universal is licensed per developer and is available as a Perpetual License with a 12 month support and maintenance subscription. See our DevExpress Universal licensing page for full details.
For more information, visit our DevExpress Universal product page.
電話: (888) 850 9911
Fax: +1 770 250 6199


